Pipeline 5.5

An automatic metadata augmentation

It is common for an application to generate a table of values as output. In order to extract the values from all cells and append them to the metadata file, we would have to define a specific rule for each cell. This can be time consuming. To expedite this, there is an automatic extraction feature that asks the user to define the characteristics of the output table and uses this information to append elements to the metadata file. Learn more

Macbook Pro Retina display support

If you have a Retina Macbook pro, this new version will look much better on your notebook than previous versions.

(August 21, 2012) Pipeline version 5.5 is available for download. This update added a new feature in Metadata augmentation and fixed many bugs. For more details read Release Notes

Web Service Module


User can now use web services in the workflow by creating Web Service module. SOAP (Simple Object Access Protocol) based web services are supported, all you have to do is to provide WSDL file for the web service, and the Pipeline will parse and generated appropriate web service module. For more information, check our User Guide – Web Service Module.

Workflow Comparison Utility

 The Workflow Comparison (diff) Utility can compare workflows within the Pipeline interface and show the differences. In order to launch this component, look for the Diff Workflows item under the Tools menu. For more information, check our User Guide – Workflow Diff Utility.

Data Extraction


 Metadata from Study modules can be read and written by any execution modules. Data Extraction enables extract (read) contents from the metadata and feed contents to the executable/module. Any value from the metadata can be pulled and put along with input or output parameter under the command line. For more information, check our User Guide – Data extraction.

Metadata Augmentation


Metadata from Study modules can be read and written by any execution modules. Metadata Augmentation allows the modification (write) of metadata with contents generated from the underlining executable. You can add, modify or remove elements from the metadata file, with values from input parameters, or output stream and error stream of the executable. For more information, check our User Guide – Metadata Augmentation.

Previewer

You can preview the image output files of your completed workflows. You can preview the outputs in two ways, hoover over the mouse pointer at the output parameter node on the workflow canvas, or hoover over the mouse at output files panel of the module. If you have multiple instances, by pointing mouse at output parameter node on the canvas, the previewer will let you scroll through all of the instances. Commonly used image file formats (e.g. .img, .nii, .mnc) are supported.

Copy Output

Copy output is a handy feature that allows you copy any completed modules’ outputs. When you paste, each output parameter will be converted as data source, with all the output files listed. If there are multiple output parameters for that module, multiple data sources will be created with their corresponding files. This feature is helpful when you want to take already completed output files from one workflow to a new workflow.

Cancel Instance

 
 Pipeline 5.3 allows user to cancel any pending instance of a module. All the related instances of the subsequent modules will be canceled as well.

Custom Grid and Environment Variables

Server administrators can now control Pipeline’s grid engine variable usage and set restrictions to them and their values. This also allows arbitrary variable names and values. In addition, user can now define environment variables for any module. For more information, check our Server Guide – Grid Variables Policy.

For detailed change logs, please check the release notes.

keywords: change log, release note

Module Creation Utility

Pipeline now can create new modules based on help string, manual file, or a webpage showing usage and parameter descriptions. All you have to do is to paste these texts, and Pipeline will attempt to convert this textual description of the tool execution syntax to a module definition. It covers most standard man page format, and you can modify any parameters and the module will be updated on the fly. More info…

Instance Restart

You can now restart any completed or errored instance in a workflow, under Execution Information. The instance and its successor instances will be resubmitted to run. Their output files will be deleted as well, to avoid possible conflict on subsequent run.

Tools Usage Stats

The Pipeline server now stores executable usage information on all tools/packages. The Usage Stats page shows the usage statistics on the LONI Pipeline Cranium server. It contains daily and monthly usage information including CPU hours of all executions, number of jobs submitted to the grid, and number of connections to the server. It also has usage information on individual packages, identified by the Package field under module’s definition.

Local Workflow Persistence


Now your local workflow statuses will be stored for later retrieval. Upon starting the Pipeline client, you’ll notice all your locally-ran sessions under Active Sessions. You can reconnect to any session to check statuses of its modules.  
 

Copy with Input

Copy with input is a handy feature that allows you copy any modules with their inputs on a completed workflow. You will see the option when you select completed module(s) and right-click. It copies everything you selected, additionally, it also copies necessary input files from the preceding modules that are not selected. These intermediate inputs will be put included as data sources.

Remote Update for Server

Pipeline server admins can now update and restart the Pipeline server, as well as update external tools/packages for the Pipeline server remotely using server terminal utility. When a new version is released, server terminal utility will inform the server admin, the server can be updated with a click of a button.

Server Status Charts

Pipeline 5.2 shows the status of connected server in graphical charts. The charts include information on how busy the server is, and how much resources you’re currently using and how much free resources are available for you. All this information appears at the bottom right corner of Pipeline window when you connect to the server.

Error Log for Data Sinks

 
Failed data sink modules now includes detail information on the error messages. Just right-click on errored data sink and choose View Error Logs. 
 

Execution Log Pages

 
For modules with many instances, execution log dialog now divides the single list into page view.  
 

Annotation Features

 
New annotation features include image annotations with resize, collapsible/expandable annotations, and workflow toolbar with annotation shortcuts.  
 

For detailed change logs, please check the release notes.

keywords: change log, release note
  1. Editing Preferences.xml
  2. Server Configuration Tool
    1. General
      1. Hostname and port
      2. Temporary directory
      3. Scratch directory
      4. Log file location
      5. Use privilege escalation and Enable guests
      6. Persistence
      7. Days to persist session status
      8. History directory
      9. Crawler persistence URL
      10. Server library
    2. Grid
      1. Grid engine native specification
      2. Job name prefix
      3. Grid complex resource attributes
      4. Grid Variables Policy
      5. Max number of parallel submission threads
      6. Max number of resubmissions for “error stated” jobs
      7. Grid total slots
      8. Array jobs
      9. Grid plugin
      10. Finished job retrieval method
      11. Pipeline user is a grid engine admin
      12. Grid job accounting
    3. Access
      1. Server admins
      2. Directory access control
      3. User management
      4. Non-user-based Job management
      5. Workflow management
    4. Mappings
      1. Packages
      2. Executables
      3. Utilities
    5. Advanced
      1. Failover
      2. Log email
      3. Network
      4. Maximum number of threads for active jobs
      5. HTTP query server
      6. Automatically clean up old files
      7. Maximum number of metadata threads
      8. Warn when free disk space is low
      9. Server status
      10. Directory source recursive timeout
      11. External network access queue
      12. Validation warning
      13. NFS directories for validation
      14. Check and verify output files
      15. Test server library

You can customize your Pipeline server in two ways. Either by editing preferences.xml file, or using the Server Configuration Tool.

3.1 Editing Preferences.xml

You can find out the XML tags for a particular preference, or read the old version of server guide, here: Server Preferences Configuration.

3.2 Server Configuration Tool

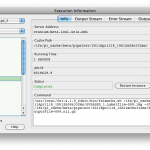
This tool is included in the Pipeline distribution and can be opened by typing:

$ java -classpath Pipeline.jar server.config.Main

The Server Configuration Tool will open with default values. If you already have a Pipeline server preferences file, you can load it up by pressing the Load button on lower right.

You can view and make changes in any of the fields (to be explained in details below). After you are done, just click Save button on lower right corner. It will first validate your inputs and then save it to a file. If you already have a preferences file loaded, it will be overwritten, otherwise, it will ask where you want to save this newly created preferences file. At any time, you can restore to default values by clicking Restore button on lower right corner. After restore, all the changes after the last save will be discarded.

When you are done configuring preferences, you can start the Pipeline server with saved preferences file by

$ java -classpath Pipeline.jar server.Main -preferences preferences.xml

3.2.2.1 General

Interface Overview
The General tab lets you specify the most basic information needed for the Pipeline server.

3.2.1.1 Hostname and port

The server hostname is the hostname of the computer that you want the server to run on. It requires the fully qualified domain name of the computer that it is on.

The default port number is 8001. If you are using default port, you can leave the field blank. You can identify the server by just using the server hostname. If you use a non-default port, you have to identify the server by hostname:port format.

3.2.1.2 Temporary directory

The temporary directory is where all intermediate files for all the executed programs are stored on the server. This directory should be accessible from the Pipeline server as well as compute nodes. The Pipeline server will create a structure under there, and the compute nodes will read from and write to that directory. For example if you specify /ifs/tmp, the Pipeline server will create a directory /ifs/tmp/username/timestamp and put all the working files there.

Where username is the user that is running the server and timestamp is the time at which each workflow gets translated before execution. Inside each of those ‘timestamp’ folders will be all the intermediate files produced by executables from submitted workflows. Depending on the number of users using your server and the kind of work they do, this directory can balloon up very quickly.

If you check the Secure checkbox, the Pipeline server will store the temporary directory more securely.  Each workflow’s directory will be accessible only for the user who started the workflow.

It is suggested to specify a non-existing directory as temporary directory if you start your Pipeline server for the first time. The Pipeline server will create appropriate files at start up.

3.2.1.3 Scratch directory

The scratch directory is utilized in workflows to make data sink paths portable across Pipeline environments. In particular, this field is linked to the {$tempdir} special variable available to all Pipeline workflows. The server administrator should configure this to be the path to a directory to which all Pipeline users can write. If the grid is utilizing NFS, this directory must be available to all the compute nodes that the Pipeline server manages. When configured, this value is stored in the Pipeline user’s home directory, inside the userdata.xml file. Upon connecting to the Pipeline server, the client requests this value and stores it in the local userdata.xml file. Any references to the {$tempdir} variable in workflows are replaced with the configured value.

3.2.1.4 Log file location

If you want to explicitly set the directory location that your log files will write to, you can specify the path here. In order to define the prefix in which the log files will be named, simply add that to the end of the directory path. The unique number denoting the log file will be appended onto the file name. For example, if we specify log file location as  /nethome/users/pipelnv4/server/events.log, then log files will be created in the /nethome/users/pipelnv4/server/ directory, and will be named events.log.0, events.log.1, and so forth.
Note : The directory of log files MUST EXIST, before starting the server.

3.2.1.5 Use privilege escalation

When you have different users connecting to your Pipeline server, you might want to enforce different access restrictions on each user. If you’re running your Pipeline server on a Linux/Unix based system (including OS X), you can enable privilege escalation which will make the Pipeline server issue commands as the user who submits a workflow for execution. For example, if user ‘jdoe’ connects to a Pipeline server with privilege escalation enabled, any command that is issued on behalf of that user will be prefixed with ‘sudo -u jdoe ‘. This way all the files that are accessed and written by the user on the Pipeline server will be done on behalf of ‘jdoe’.

Remember, there is no harm in not enabling privilege escalation on your Pipeline server. All files will simply be created and read as the Pipeline server user. You will be giving uniform access to your system to all users. Additionally, it makes it easy to lock down the access of all Pipeline users because you only have to lock down the access of one actual user on your system; the Pipeline user.

In order to enable this feature in the Pipeline, you need to do two things. 1) modify your system’s sudoers file to allow the user that runs the Pipeline server to sudo as any user that will be allowed to connect to the system and 2) check “Use privilege escalation” under server configuration tool.

Enable guests option lets you grant guest log in to the server. The guest username is randomly generated by the client with the format “guest-[random 8-character string]”. If enabled, the guest will be able to connect to the server, submit workflow as Mapped guest user, and retrieve workflows by this guest. Regular users will not be affected in any way, and each guest will not have access to other guests’ workflow either. Pipeline Web Start and Workflow Library Navigator are set up with guests enabled.

3.2.1.6 Persistence

Pipeline server uses hsqldb to store information, including workflow status and module status. By default, it is stored in Pipeline server’s memory, and will be removed when the Pipeline server stops. Alternatively, you can start a hsqldb server and make it save to an external file. You can go to hsqldb website to download the jar file. To start a hsqldb process, run something like this:

java -cp ./lib/hsqldb.jar org.hsqldb.Server -database.0 file:/user/foo/mydb -dbname.0 xdb

After successfully starting hsqldb, you can put the persistence database information to server’s preference. The URL for the above example will be:

jdbc:hsqldb:hsql://localhost/xdb

Username and password can be configured as well, refer to hsqldb documentation for more information.

3.2.1.7 Days to persist status

This item specifies number of days a completed workflow can be stored on the server. The Pipeline server periodically checks and cleans up completed workflow sessions older than the number of days specified (counting from the workflow session’s completion time). The default value is 30 days. If a session is cleared, all its temporary files under the temporary directory will be removed.

3.2.1.8 History directory

History directory is a directory to store history/logging information on the server. If specified, each submitted workflow will be stored with timestamps and user information, even when user resets the workflow or the workflow is automatically removed from active sessions. Pipeline admins could see the history lists under server terminal’s Workflows tab and Users tab (check Show full history).

3.2.1.9 Crawler persistence URL

This item specifies the hsqldb URL of optional workflow crawler. If a valid hsqldb URL is specified, Pipeline server will start a workflow crawler thread, which crawls every submitted workflows (and history workflows if there exists) for module usage statistics. The statistical information is used to help user select and explore modules. Features such as Module Suggest, ranked server library search result, and Workflow Miner all use statistics gathered from crawler.

The crawler persistence database uses hsqldb, like the main persistence database. Setting it up is similar to setting up main persistence, with slight changes in db name and ports, for example
Main: java -cp ./lib/hsqldb.jar org.hsqldb.Server -database.0 file:/user/foo/maindb -dbname.0 xdb -port 9002
Crawler: java -cp ./lib/hsqldb.jar org.hsqldb.Server -database.1 file:/user/foo/crawlerdb -dbname.1 cdb -port 9003

URLs
Main: jdbc:hsqldb:hsql://localhost:9002/xdb
Crawler: jdbc:hsqldb:hsql://localhost:9003/cdb

3.2.1.7 Server library

When Pipeline client users connect to a server, the client syncs up the library of module definitions available on that server. The location of that library on the server is specified by Server library location field in the preferences. By default, the location is set to one of the following locations (based on OS), so you don’t need to specify this preference if you’re happy with it:

  • Linux/Unix – $HOME/documents/Pipeline/ServerLib/
  • OS X – $HOME/Documents/Pipeline/ServerLib/
  • Windows – %HOME%\Application Data\LONI\pipeline\ServerLib\
  • Windows Vista/Seven – %HOME%\Documents\Pipeline\ServerLib\

Put all the module definitions that you want to make available to users into the directory, when the server starts up, it reads in all the .pipe files in the directory (and all its sub directories). When clients connect, they will obtain a copy of the library on their local system. The server monitors the directory for changes/additions in any of the files while it runs. if change occurs, the server will automatically checks the files (no restart required) and synchronize clients again when they reconnect. Even when clients are connected during the change, they will get the new version of the server library instantly.

By default, the sever monitors the timestamp of the server library directory. However, if you have sub directories and you make changes inside these sub directories, server will not see the change as the library directory’s timestamp was not changed. You can solve this by checking “Monitor library update file”, and specifying a path (by default, it’s a file called .monitorFile under your library directory), this way the Pipeline server will monitor this particular file, instead of the library directory, to know when the library is updated. So when you update your server library, you can update this file to inform the server the library has been updated.

3.2.2 Grid

Interface Overview
The Grid tab lets you specify the grid-related parameters for the Pipeline server. If it’s not enabled, all jobs will run locally on the Pipeline server machine.

3.2.2.1 Grid engine native specification

This field lets you specify a native specification string that goes along with your job submission (if none of that makes any sense, just skip this preference because you don’t need to use it on your server). On the LONI Pipeline server we use the following native specification preference:

-shell y -S /bin/csh -w n -q pipeline.q -b y _pmem _pstack _pcomplex _pmpi -N _pjob

The native spec you should use for your installation will vary, but if you’re using an Oracle Grid Engine (previously known as Sun Grid Engine) installation and you want to use the same string, you’ll want to change the -q pipeline.q to reflect the submission queue (if any) that you will be using.

Optionally, you can add _pmem and _pstack to the native specification. _pmem enables user define maximum memory per module, and _pstack enables user to define the stack size. Both of these can be configured by the user using the latest Pipeline client, and they all use the default set by the grid engine unless user specifies.

You can also add following:
_pcomplex which refers to Grid complex resource attributes.
_gridvars which refers to Grid Variable Policy ( Available since version 5.3)

3.2.2.2 Job name prefix

In some environments, server admins may want to visually see which jobs are submitted by pipeline and which jobs are not. This can be done by setting prefixes for all jobs which are started by pipeline. The “Job name prefix” field expects a string value which will be prepended on each job’s name. For example, you could set the value of it to “pipeline_” and all job names will start with it ( i.e. pipeline_echo, pipeline_sleep, pipeline_bet, pipeline_reallign, etc. ).

IMPORTANT: This change will be in effect ONLY if Grid Engine Native Specification contains the _pjob value. The “_pjob” value sets the name of each job with the same name as executable filename. If _pjob is not specified, then prefix won’t be prepended to job’s name.

3.2.2.3 Grid complex resource attributes

Grid complex resource attributes lets the Pipeline server check for the jobs which are submitted by Pipeline but not monitored by it anymore. This happens when the job is in a submission process and the server turns off. When the job submission is complete and Pipeline is down, the job id will not be written in the Pipeline database. Which means that this job will use the slot, but Pipeline will not “remember” the job id. When server restarts it gets the list of running jobs on cluster and compares with its database. To determine which jobs are submitted with current server Pipeline uses grid complex resource attributes. When Pipeline finds jobs which are submitted by current Pipeline but are out of control, it deletes them to free up the slot.

This tag allows you to assign custom complex attributes to all submitted jobs by the server, which will make jobs identifiable. You can have multiple values in the tag seperated by comma. For example
pipeline, serverId=server1
Following defines two attributes 1) pipeline which is equal to TRUE and 2) serverId which is equal to server1.

This tag is just a definition of complex attributes. In order to use them you have to define _pcomplex in Grid engine native specification. In our case, the _pcomplex will be replaced with -l pipeline -l serverId=server1 when submitting the job to the grid.

Note that the Grid manager has to be configured properly to accept jobs with given resource attributes.

3.2.2.4 Grid Variables Policy

Starting from Pipeline version 5.3, server administrators are able to control grid engine variable usage and set restrictions to them and their values.

By default, if nothing is set, Pipeline will not allow any grid variables to be used by users.

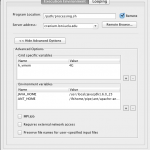
To configure Grid Variable Policy, open the Configuration tool’s Grid Panel and follow the example instructions below:

Let’s say we want to give users a permission to use variables h_vmem and h_stack. So we need to select “Disallow all variables, except specified” from drop down box Grid Variables policy and write in the textbox semicolon separated values:

h_vmem; h_stack

As each grid engine is different, there can be different formats of how to specify grid variables. For example for SGE we need to have “-l” prefix before each resource value. So we need to put “-l” in “Prefix before each tab” field.

Any of these variables may require a suffix to be attached after their values, for example in SGE h_vmem needs to be written in following format h_vmem=5GAs you can see there is a G suffix and we need to have that in our policy.

To introduce the suffix, we will change the “Grid Variables policy” to:

h_vmem [G]; h_stack[m]

Where “G” is the suffix for h_vmem variable and “m” is suffix for h_stack. After saving this change, without any server restart, Pipeline will not allow any grid variable to be used other than these two.

Alternatively Pipeline administrations can set limits for values, for example if we want h_vmem to have value from 1Gb to 8Gb and h_stack from 0mb to 256mb, then we’ll need to have following configuration:

h_vmem [1-8G]; h_stack [0-256m]

If you want to specify some specific values, but not ranges of numbers, then you have to use following syntax:

h_specific_value ( valueX, valueY, valueZ )

If you combine this with previous configs, then you’ll get:

h_vmem [1-8G]; h_stack [0-256m]; h_specific_value ( valueX, valueY, valueZ )

So as you can see, ranges must be specified with following format [Min-Max Suffix] and specific values must be ( Comma, Separated, Values )

Another option is to allow everything except some of the variables, this has the same format and in order to use it, select “Allow all variables, except specified” item from drop down box.

And finally, you can set multiple ranges for each variable. This becomes useful when you want to give a choice of suffixes to users. For example if you want your users be able specify the h_vmem and in Gigabytes and in Megabytes. So the configuration should look like this:

h_vmem [1-8G, 1000-8000M]; h_stack [0-256m]; h_specific_value ( valueX, valueY, valueZ )

If the user doesn’t specify a suffix to value ( for example : 4 instead of 4G ) then Pipeline will automatically use configured suffix. If there are multiple suffixes, Pipeline will set the first suffix as default.

NOTE: The Grid Variable Policy will be enabled only when there is _pgridvars variable defined in Grid Engine Native Specification field. Otherwise, the Pipeline validation will only validate grid variables, but will not include them in job submission specification. Here is an example of native specification which will enable the Grid Variable Policy:

-shell y -S /bin/csh -w n -q pipeline.q -b y _pgridvars _pcomplex _pmpi -N _pjob

So if you want to use Grid Variable Policy, make sure you have _pgridvars variable defined in native specification.

Please see Grid engine native specification for more details.

3.2.2.5 Grid maximum submit threads

This field lets you specify the number of parallel job submissions. For example, if you specify 1, it will submit jobs one by one. If you specify 10, it will allow maximum of 10 parallel submissions at a time.

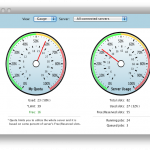
3.2.2.6 Grid total slots

The Pipeline client lets user to see the activity of the Pipeline server, how busy the server is and how many total slots are available on the grid. These total slots fields tell the server how many total slots available on the grid either dynamically (by running the command) or statically (by providing a number).

Grid total slots command asks for a command line query to get the total number of available slots for the queue that the Pipeline server is using. Refer to your cluster management documentation for the appropriate query. By using this tag, the server will query the grid engine periodically to get the latest number of available slots, and update the number automatically, and broadcast the new number to clients.

The grid total slots field lets you give the number of total grid slots for the cluster. This number is less accurate if the slot counts on the grid changes regularly.

You can provide both dynamic command and a static number, server will use the dynamic command first, and if it doesn’t work, it will use the static number.

3.2.2.7 Max number of resubmissions for “error stated” jobs

When submitting jobs to the grid, jobs can fail before starting to run. For example, if the job submitted with sudo but the node where the execution started doesn’t have information about that user, then the grid engine would complain and put the job in error state. In this case, it is possible that resubmission of this job would put the execution in another node which doesn’t have the same problem.

This property tells pipeline how many times to resubmit the job after its state is set to “error”. Please note that this doesn’t mean that every execution which fails pipeline will try to resubmit, no, it will not resubmit any job which execution successfully started but the exit code of the executable is other than 0. For example, if you run cp command with one argument, it will fail, but pipeline won’t resubmit it because the execution has been successfully completed independent of its result.

3.2.2.8 Array jobs

Sometimes job submission can take a long time when each instance of a module is submitted as an individual job. Array jobs solve this problem and dramatically improve the job submission speed. Starting from version 5.1 you can enable array jobs on the Pipeline server so instead of submitting individual jobs it can submit array of jobs. This feature improves the speed of submission especially for modules with multiple hundreds/thousands of instances. Dependent of the module’s number of instances there is 10%-65% speed improvement when using array jobs versus individual jobs.

Parameters

When a workflow is started and it contains a module with large number of instances, submitting array jobs small number of tasks at the beginning will be time efficient.

Before submitting the job array, Pipeline has to create a special script and configure it for each instance. This procedure takes time and during the preparation grid engine will be idle. For example: Let’s say we have a module with 1000 instances. It will take shorter time to prepare 50 jobs for submission than 1000 jobs. So you can configure the value of “break into chunks when number of jobs exceeds“, which tells Pipeline to split into chunks instances of those modules which has cardinality X and more. It is a positive integer number and indicates the minimum cardinality value the module is required to have in order to split into chunks.

The chunk size tells the Pipeline server the size of an array job. So if we set break into chunks when number of jobs exceeds 200, and chunk size 50, and user submits a workflow with 200 instances, the Pipeline server will divide them into 4 array jobs, each with 50 instances.

Sometimes after the first chunk it is better to gradually increase chunk size, because after the first chunk submission the grid engine will not be idle and we can afford submitting larger array jobs. If this is enabled, after the first submission the Pipeline server will double the chunk size upon each iteration.

For example: If we have a module with 1000 instances and chunk size is 50, break into chunks when number of jobs exceeds 200, then it will submit array jobs with following sizes

Array Job # Number of instances Total submitted so far
1 50 50
2 100 150
3 200 350
4 400 750
5 250 1000

The maximum chunk size sets the upper limit of the increase. The Pipeline server will double the chunk size for each array job until the maximum chunk size is reached.

There is one special case: during the submission Pipeline checks how many instances remain to be submitted and when the remaining is more than the limit but there is only less than 10% left, then remaining instances will be carried with last job array. Here’s is an example with total of 768 instances.

Array Job # Number of instances Total submitted so far/ Remaining
1 50 50 / 718
2 100 150 / 618
3 200 350 / 418
4 418 768 / 0

The last 418 is more than the specified 400. But 418-400=18 which is less than 76 ( 10% of total 768 instances).

3.2.2.9 Grid plugin

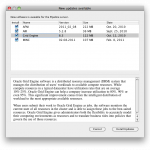
The Pipeline server lets you create your own plugins to communicate with various Grid managers (see also Pipeline Grid Plugin API Developers Guide). Pipeline package contains two built-in plugins for Oracle Grid Engine (previously known as Sun Grid Engine) which are JGDIPlugin and DRMAAPlugin. In installed package of Pipeline, under the lib directory there is directory called plugins in which you can find these two plugins.

If you are using either JGDI or DRMAA, just select it under the drop down, everything will be filled in for you. If you are using your customized plugin, you need to specify the jar file location, and class name of the Plugin used by Pipeline.

IMPORTANT: Some plugins require to be defined in class path. For example DRMAA Plugin requires from you to put the path of drmaa.jar in class path when starting the server. So to start the server with DRMAA plugin you need to have

$ java -cp .:/usr/pipeline/dist/lib/plugins/drmaa.jar
Pipeline.jar server.Main

3.2.2.10 Finished job retrieval method

This option is mostly for advanced cases. When Pipeline server restarts,it is possible that some of the jobs which continue to run will finish while the server is offline. In this case when server starts up in needs to get information about the finished job from grid engine’s accounting database or files or some other place. Different grid plugins have different options for retrieving information about finished jobs. For example, the JGDI Plugin supports the option for retrieving information from SGE’s ARCo database. It may be possible that the same plugin has different methods to get that information and in that case Pipeline server administrator would want to choose the method.

This property requires a string value which will be sent to the grid plugin. Most of the grid plugins have their default methods for retrieving job information. In those cases this property is not needed to be set. For example, if we want to use ARCo database from JGDI plugin we could just leave this property empty ( as ARCo database is the default method for JGDI plugin ) or just simply set it to “arco”. Please refer to grid plugin documentation to get more information about what methods they support and how to configure them.

3.2.2.11 Pipeline user is a grid engine admin

When privilege escalation is set to true, pipeline submits jobs on behalf of the users who submit the workflow. If Pipeline user is a Grid Engine admin ( configured by grid engine administrators ) and if it is able to delete any users jobs, then this property is recommended to be unchecked as the performance will be faster.

When this checkbox is selected, then pipeline will tell the grid plugin to kill the job on behalf of the user. For example in SGE that call would be sudo -u #user qdel #jobId*, where #user is the username and #jobId is job’s Id.

3.2.2.12 Grid job accounting

After Pipeline server restarts some jobs may already been finished or changed their status. This events haven’t been caught as Pipeline server was not running at that moment. In order to get the status of “missed” events, Pipeline gets information from configured Sun’s Accounting and Reporting Console (ARCo) database. Note this feature is only tested for Oracle Grid Engine (previously known as Sun Grid Engine) with JGDI and DRMAA plugins, if you are using another grid manager, and it does not work, please report it on our Pipeline forum.

Assuming ARCo database is configured and running (refer to ARCo website and your system administrator for help). To configure ARCo database in Pipeline you need to put information about the database URL, username, and password. The URL looks like this:

jdbc:mysql://hostname/db_name

3.2.3 Access

Interface Overview
The Access tab lets you configure user-access and workflow management for the Pipeline server.

3.2.3.2.1 Server admins

This field lets you specify a list of user names that are Pipeline server admins. Pipeline server admins can connect to the server via Pipeline Server Terminal Utility to monitor and manage the server. They can view, stop, delete anyone’s workflows on the server, view a list of connected users and their IP addresses, server’s memory and thread usage, as well as edit all the server preferences discussed on this section.

If there’s no server admin specified yet, you need to directly edit server’s preferences.xml file. The xml element is called ServerAdmins. For example, if you want john and jane to be server admin, then preferences.xml file should look like this:

<preferences>
...(other items)...
<ServerAdmins>john, jane</ServerAdmins>
</preferences>

After saving changes to preferences.xml file, you need to restart Pipeline server.

3.2.3.2.2 Directory access control

The Pipeline server lets you control user access on the executables/modules they can run and files they can browse on the server.  Below is a matrix chart for different mode:

Mode Executables Access Control Remote File Browser Access Control
0 Never Never
1 No with exceptions Never
2 Yes with exceptions Never
3 No with exceptions No with exceptions
4 Yes with exceptions Yes with exceptions
5 No with exceptions Same as shell permissions
6 Yes with exception Same as shell permissions
7 Same as shell permissions Same as shell permissions
8 Users with shell access: Same as shell permissionsUsers without shell access: Yes with exceptions Users with shell access: Same as shell permissionsUsers without shell access: Yes with exceptions

Never means Pipeline server will not do any access control restrictions for any user. Note this will not affect operating system’s authentication and access control, in other words, the credentials required to connect to the Pipeline server and the rights required to execute programs will not be affected by the settings here. No with exceptions means access control is not enabled for all users except those marked in controlled users will be restricted. Yes with exceptions means all users will be restricted except for those specified in controlled users will be allowed. Same as shell permissions means the remote file browser will act as if user logged in to the server using shell.

Controlled users
This is a list of users separated by commas (i.e. john,bob,mike) which will indicate conditional users. Depending on the control mode, These users will be restricted or allowed.

Controlled directories
This is a list of directories separated by commas (i.e. /usr/local,/usr/bin), which will be the only directories allowed for restricted users.

Examples
We want to restrict user john, bob, mike to execute programs only in: /usr/local and /usr/bin, and let every user browse using remote file browser as shell does, we would have these configurations:
Mode: 5
Controlled users: john,bob,mike
Controlled directories: /usr/local,/usr/bin

Another example, if we want to restrict all users to execute programs only in: /usr/local and /usr/bin, but allow users john, bob, mike to run without restrictions, and let every user browse using remote file browser as shell does, we would have these configurations:
Mode: 6
Controlled users: john,bob,mike
Controlled directories: /usr/local,/usr/bin

3.2.3.2.3 User management

Pipeline version 5.1 introduces new user management feature. It has a special algorithm that provides a fair share resource to all users.

How it works
When enabled, you need to set up a percentage that will limit each user’s jobs. The percentage is calculated by taking the number of free slots at submission time.

For example: the Pipeline server has 150 slots available and the user management percentage is set to 50%.

The first user will be able to use 50% of 150, so 75 slots will be used by user A.
Then User B will be able to submit 50% of free slots which is 50% of (total 150) – (user A’s 75) = 50% of (free 75) = 37 and so on.

Pipeline server constantly checks and monitors the user usage and adjusts each user’s limit.

3.2.3.2.4 Non-user-based Job management

Pipeline version 7.0 introduces new job management feature that has limits independent of the limits on the user who submitted it. The job management algorithm has been updated to consider both user management and job management factors when decided to run a job.

How it works

<EnableNodeManagement>true</EnableNodeManagement>
<ControlledNodes>
<node name=”ControlledModule1″ limit=”200″ />
<node name=”ControlledModule2″ limit=”150″ />
</ControlledNodes>

When enabled, you need to set the module name and limit for number of jobs that can be run by a module with this name. The limit is global across all users and jobs submit via Pipeline.
For example: A user runs a module named ControlledModule1 which submits 180 jobs. Other users who run modules with this same name (name only, the actual definition of the module is not considered) will find that this module can only submit 20 jobs and the rest will get backlogged. This assumes that their user quota (see above) has not been reached yet. If they user quota is already reached, Pipeline will not submit any jobs.

This feature is useful for jobs that have special limitations that need to be enforced. For example, a job that communicates with some external service and you don’t want to overload this service with thousands of requests. You can create a uniquely named module to describe this job and limit it across the server to protect resources.

3.2.3.2.5 Workflow management

Workflow management lets you manage active (running and paused) workflows per user on the Pipeline server. If it’s enabled and a limit has been set, the number of active workflows for any single user will not exceed the limit. Any workflow submitted after the limit is reached will have a backlogged status. They will be queued until any of the user’s running workflows completes.

3.2.4 Mappings

Updated: The Packages and Executables tabs are now disabled when running configuration tool. Instead, you can edit by connecting to the running Pipeline server using Server Terminal > Preferences tab. All the values under Packages and Executables tabs will be dynamically updated without restarting the server.

The Packages and Executables tabs give the administrator the ability to configure mappings that allow for Pipeline workflow portability between Pipeline servers. In particular, information about an executable (in the form of the executable package, version, or name) can be used to determine where that executable resides on a given file system and whether it requires the setting of certain environment variables. The following sections describe this interface in greater detail.

3.2.4.1 Packages

Interface Overview
The Packages tab allows you to set up a list of available packages/tools and their locations on the server. This allows the Pipeline server automatically correct user-submitted module’s executable location based on its package name and version.

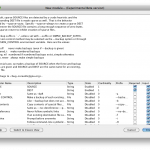
There are five columns in the table, package name and version, location, variables and sources. Package name and version are used to compare against user-submitted module definition, they should uniquely identify a package on the server. Version value can be empty which corresponds to empty version in the module’s definition. Package location is the local path to the package where all the executables are located. Variables and sources are optional, which defines environmental variables needed for the package (in name=value format) and scripts to be sourced before running respectively.

To add a package, click on Add and put name and version of the package. You can double-click on any of the columns to edit them, for Variables and Sources, you’ll see a new dialog pops up after the double-click, to let you easily input multiple entries. To delete a package, just select it and click Remove. Make sure to hit the ‘Save Server Preferences’ button to save the settings.

3.2.4.2 Executables

Interface Overview

The Executables tab improves the portability of Pipeline modules in the following sense. If we have a Pipeline module that runs /usr/bin/java -jar /usr/local/some_package-1.0/bin/program.jar, we can use the package mapping utility (described above), to say that program.jar belongs to the package ‘some_package’, version ‘1.0’, include this information in both the Pipeline module definition and the Packages tab in the server terminal GUI, and we would be able to share this module with a user connecting to a different Pipeline server (with the proper configuration). However, we are still assuming that both systems have /usr/bin/java. With the executables mapping, the executable name ‘java’ can be configured to map to any location, making the module fully portable.

Much like the Packages tab, the Executables tab allows the administrator to create a correspondence between executables and their location in the relevant filesystem. In this case, the interface has three columns. In the first column, the user needs to specify the executable name (e.g., java, perl). The second column requires the user to specify a version number for the executable. This can be useful if Pipeline users are utilizing several different versions of an executable and need to be able to specify the version needed by a particular Pipeline module. If the version number is not relevant, an asterisk (*) can be used to indicate any version. Finally, the last column, labeled ‘Location,’ is used to indicate the path on the grid’s execution hosts where the executable resides (e.g., /usr/bin/java).

To add an executable, click on Add and enter the executable filename, version, and full path. To delete an executable, just select it and click Remove. Again, make sure to hit the ‘Save Server Preferences’ button to save the settings.
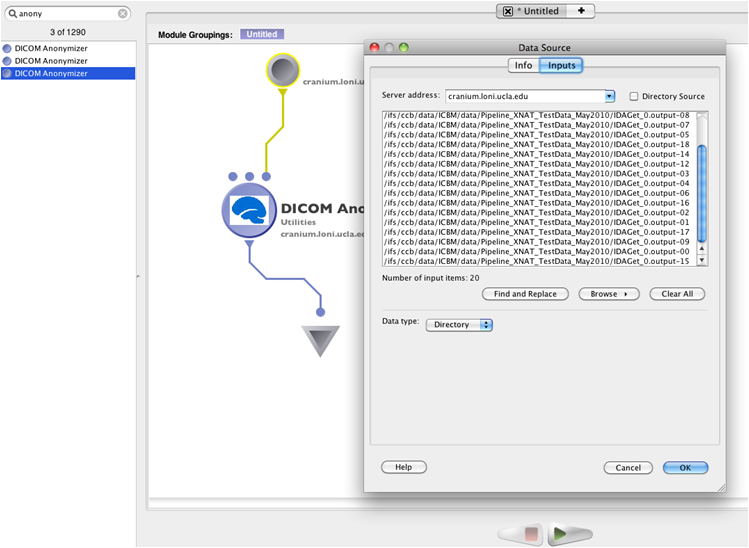
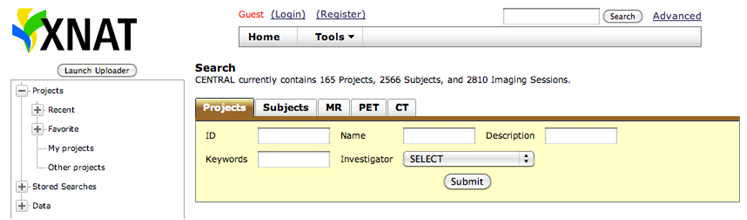
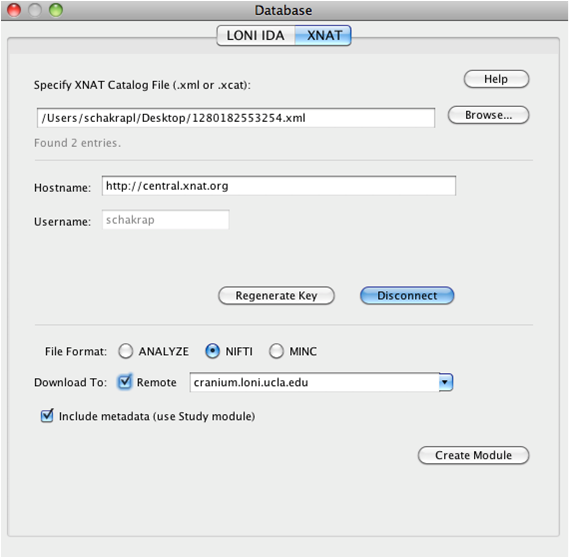
3.2.4.3 Utilities

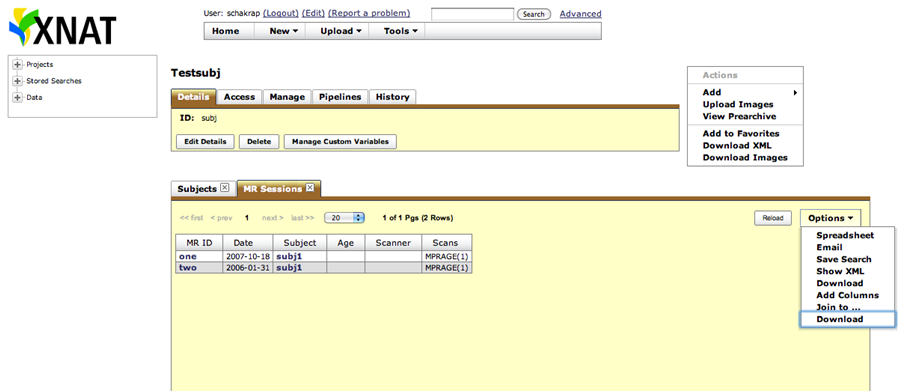
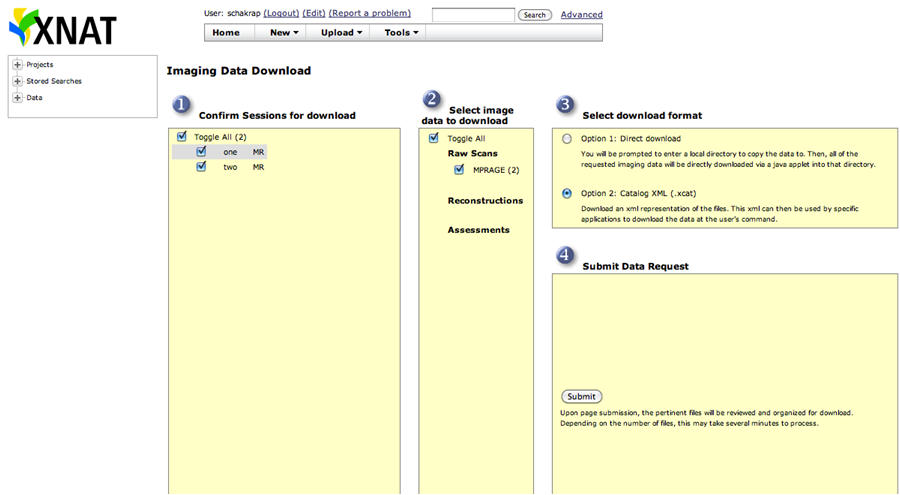
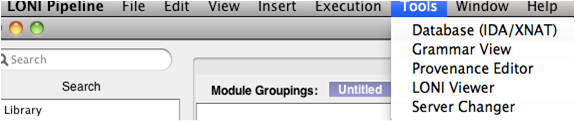
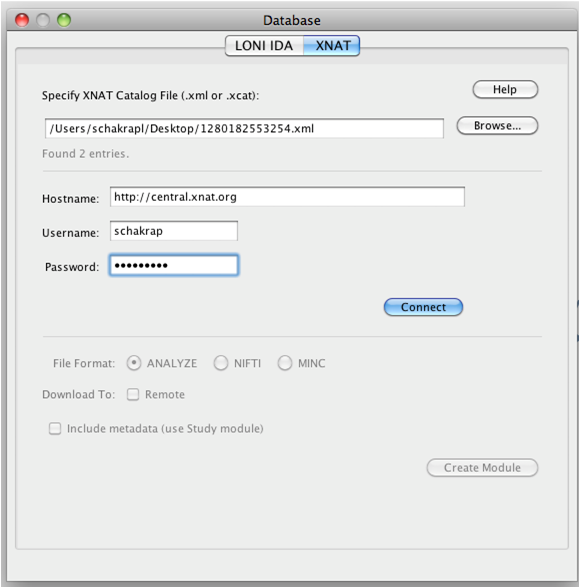
The Pipeline makes use of several utility plugins and the amount of these plugins will undoubtedly increase as the Pipeline grows. Currently, the three independent applications that the Pipeline uses are Smartline, XNAT, and IDA. These java applications are completely portable; they are packaged as jar files and are included in the standard Pipeline distribution. When setting up a Pipeline server, the administrator needs to perform three steps to ensure that these tools can be used by Pipeline clients which connect to it. First of all, the xnat, smartline, and idaget directories need to be moved to a common location. Secondly, this directory needs to be configured into the Package Mapping for the server. In particular, the package name “Pipeline Utilities” with the generic version “*” should map to /path/to/utilities, where /path/to/utilities is a directory containing the xnat, smartline, and idaget directories. This can be done very easily under the Preferences->Packages tab in the Server Terminal Utility. Finally, the path to Java needs to be configured using the Preferences->Executables tab in the Server Terminal Utility. The Package Name should be “java”, the Version should specify the version of java (or you can enter “*”), and the Location should be the path to java on your grid’s execution hosts.

3.2.5 Advanced

Interface Overview
The Advanced tab allows you to set up a list more advanced features.

3.2.5.1 Failover

The Pipeline server has an automatic failover feature. It is available on server running UNIX/Linux/Mac OS X. Failover improves robustness and minimizes service disruptions in the case of a single Pipeline server failure. This was achieved by using two actual servers, a primary and a secondary, a virtual Pipeline Server name, and de-coupling and running the persistence database on a separate system. The two servers monitor the state of its counterpart. In the event that the primary server with the virtual Pipeline server name has a catastrophic failure, the secondary server will assume the virtual name, establish a connection to the persistence database and take ownership of all current Pipeline jobs dynamically.

Requirements
3 separate hosts (1 master, 1 slave, 1 persistence).
Virtual IP address of the server.
User who runs pipeline should have full access to execute command ifconfig

How it works
Server of Host B pings to server Host A every 5 seconds (the interval is configurable). When there is no response (timeout) it retries ping for 3 times (the number of retries is configurable) and if all retries are unsuccessful then Host B creates an IP alias on network interface specified by and and switches to Master mode.
Alias interface
This specifies the name of interface on which the Pipeline server will create a sub interface to do IP aliasing.
Alias sub interface number
This specifies the sub interface number on which Pipeline should create the alias IP Address. If nothing specified, Pipeline will automatically find first available sub interface number and will add IP Alias on it. For example if your primary interface is eth0 and eth0:0 and eth0:1 are busy with another IP addresses, Pipeline will use eth0:2.
WARNING: If one of sub-interfaces contains IP Address of specified Hostname, Pipeline will give an error and exit.
Post failover script
This is the path to a script which will be called after the master server’s process terminates.

Instructions how to configure failover

  1. Copy pipeline server files and preferences file to two different hosts, let’s say Host A and Host B. Also we will need database to be in third host (Host C).
  2. Put the hostname and persistence information to server preferences. Under Advanced tab, check Enable failover, give alias interface and change other parameters if needed.
  3. Start the persistence database on Host C.
  4. Start the Pipeline server on Host A. It is the master server.
  5. Start the Pipeline server on Host B. It is the slave server. When Host A goes down, Host B will take over.

3.2.5.2 Log email

The Pipeline server can send log messages via email. Specify recipients email address (separate multiple entries by comma), the sender, and SMTP host. The Pipeline server will not send more than 1 message within 10 minutes. If there’s a lot of log messages, it will combine them and send in 1 email every 10 minutes.

3.2.5.3 Network

The packet size is the size in bytes of the Pipeline communication packets between the server and the client. The timeout specifies the timeout in seconds of the Pipeline communication protocol.

3.2.5.4 Maximum number of threads for active jobs

As the server becomes busier and busier, at times users may be submitting more jobs at once than the server’s capacity to handle. You can set up maximum number of threads for active jobs to prevent this. Active jobs are submitting, queued, running jobs. When number of active jobs reaches the maximum limit, server will put new jobs into a backlogged queue. When there is an available slot for execution the first job in the backlogged queue will be submitted. For grid setups, you should probably have the limit higher than the number of compute nodes available to you, because submitting to the grid takes a non-negligible amount of time, and it’s best to keep your compute nodes crunching at all times.

3.2.5.5 HTTP query server

The Pipeline server provides API for querying workflow data, including session list, session status, output files. It is helpful when you (or your program) want to query workflows on Pipeline server, without the need of Pipeline client. Please note, once enabled, it does not require any login authorization to see any workflows on the server. By default, this feature is not enabled on the Pipeline server. To enable, check Enable HTTP query server under Advanced tab and put a port number, for example 8021.

When the server is running, you can go to http://cerebro-rsn2.loni.usc.edu:8021/ and it shows an XML file listing all the APIs. Currently there are five functions:

  • getSessionsList
  • getSessionWorkflow
  • getSessionStatus
  • getInstanceCommand
  • getOutputFiles

getSessionsList returns all the active sessions on this Pipeline server. It does not take any argument, and the query URL looks like this:
http://cerebro-rsn2.loni.usc.edu:8021/getSessionsList

The Pipeline server returns an XML file listing all the active sessions, with their session IDs.

<sessions count="1">
<session>
cerebro-rsn2.loni.usc.edu:8020-453da129-c81b-4473-9fc0-8fe03481e492
</session>
</sessions>

getSessionWorkflow returns the workflow file (.pipe file). It takes session ID as argument. The query URL looks like this:

http://cerebro-rsn2.loni.usc.edu:8021/getSessionWorkflow?sessionID=cerebro-rsn2.loni.usc.edu:8020-453da129-c81b-4473-9fc0-8fe03481e492

getSessionStatus returns the status of the workflow execution, when it started, if it has finished, what time it finished, what are the nodes and instances in this workflow, and for each node, if they finished successfully. The query URL looks like this:

http://cerebro-rsn2.loni.usc.edu:8021/getSessionStatus?sessionID=cerebro-rsn2.loni.usc.edu:8020-453da129-c81b-4473-9fc0-8fe03481e492

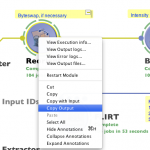
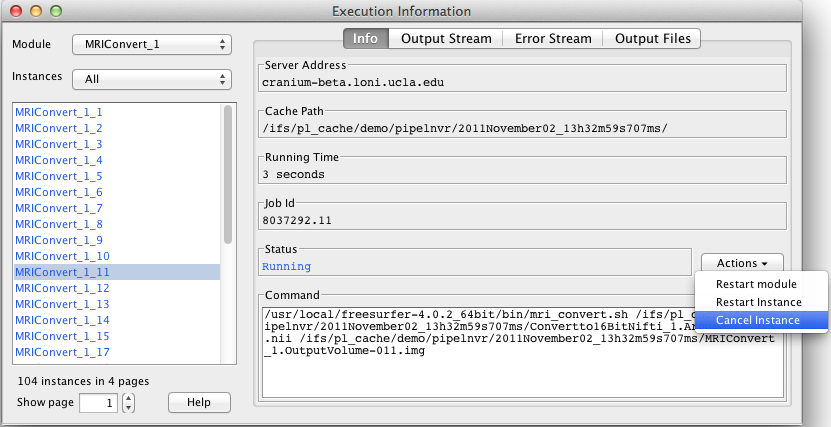
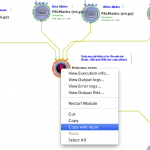
getInstanceCommand returns the command of the execution. It takes session ID, node name (which can be found by calling getSessionStatus), and instance number (which can also be found by calling getSessionStatus). The query URL looks like this:

http://cerebro-rsn2.loni.usc.edu:8021/getInstanceCommand?sessionID=cerebro-rsn2.loni.usc.edu:8020-453da129-c81b-4473-9fc0-8fe03481e492&nodeName=BET_0&instanceNumber=0

getOutputFiles returns the path of output files generated by the node. It takes session ID, node name, instance number, and parameter ID. The query URL looks like this:

http://cerebro-rsn2.loni.usc.edu:8021/getOutputFiles?sessionID=cerebro-rsn2.loni.usc.edu:8020-453da129-c81b-4473-9fc0-8fe03481e492&nodeName=BET_0&instanceNumber=0&parameterID=BET.OutputFile_0

3.2.5.6 Automatically clean up old files

If Automatically clean up old files in temporary directory is checked, then any session in the temporary directory that are older than two times the days to persist status will be removed. This will not happen under normal circumstances, because persistence database keeps track of all sessions, and no temporary directories older than days to persist status should exist. It happens in rare situations such as when the Pipeline server restarts with its persistence database manually deleted, or the temporary directory was used by other programs, and so on.

3.2.5.7 Maximum number of metadata threads

This specifies the maximum number of metadata generator threads used in workflows with Study module.

3.2.5.8 Warn when free disk space is low

If enabled, Pipeline will warn when temp and home directories’ free space goes below the specified %.

3.2.5.9 Server status

The server status refresh interval specifies how often should the server checks for grid usage counts and sends the information to the clients.  The connected clients will get the server status information.

3.2.5.10 Directory source recursive timeout

This specifies the maximum time allowed in seconds of the recursive directory source listing feature.  When user specifies a directory that contains lots of sub directories and files, the recursive directory source listing may take a long time. This timeout value limits the time allowed for a recursive listing on a directory.

3.2.5.11 External network access queue

This specifies the queue that has external network access enabled on its compute nodes. Some module may require external network access, and the general queue for the Pipeline server may not have that. By setting up a special queue that has external network access, user can submit modules with external network access checked on their Pipeline client, and the server will submit the jobs on that queue.

3.2.5.12 Validation warning

When there’s a missing input file or executable path in a workflow, and user tries to submit the workflow, Pipeline gives a validation error and asks the user to correct the invalid file. But in some circumstances the file may not exist yet at validation time, and will be valid at a later time, and as a result the workflow can’t be used as is. Validation warning solves this issue. If enabled, such invalid path will result in a warning message and user can proceed to submitting the workflow by dismissing the warning.

3.2.5.13 NFS directories for validation

If Pipeline server is used in grid environment, a shared file system such as NFS is often used. If user specified a valid file under non-NFS directory, it would pass validation but likely cause problem as the file is not accessible on each compute nodes. This issue can be solved by specifying all NFS directories of the system. Validation will catch files that are not under these specified directories.

3.2.5.14 Check and verify output files

If this option is enabled, Pipeline server will check the existence of output files after the module completed successfully. If output file was missing while the executable exited normally (return value 0), Pipeline will report the module as error/failed and not continue to the subsequent modules.

3.2.5.15 Test server library

By pressing the button, it will generate the instructions for testing the server library workflows. It uses command line interface to batch validate workflows, so you know if there’re any issues with your server library workflows.

Previous: 2. Installation Table of Contents Next: 4. Authentication
  1. Syncing Execution Flow
  2. Exporting Pipeline Workflow to Script
  3. Remote GUI Invocation
  4. Workflow Diff Utility

7.1 Syncing Execution Flow

If your pipeline requires the sequential execution of modules, but the modules do not have any dependencies on each other to regulate the ordering of the execution, then there is a way you can construct your workflow to preserve the order of execution. Let us look at a concrete example.

undefinedModule A generates an output file, which is used by both Module B and Module C. However, Module B and Module C has an “implicit dependency”, meaning that although there is no explicit input/output file passing between these two modules, Module C has to be executed after Module B is complete.  This is illustrated on the left.

The workflow above will not guarantee Module C executed after Module B is done. As soon as Module A finishes, Module B and C will start. To solve this, there are two ways.


undefined undefined Make a flow control connection between Module B and C that will force Module C to wait until Module B completes. In order to configure the a flow control connection, add a new output parameter of Module B, specify it as type Flow Control. Next, add a new input parameter of Module C, specify it as type Flow Control too. Connect these two parameters and you are done. See the modified workflow 1st from the left (the flow control connection is highlighted).

Alternatively, you create a new output parameter of Module B of type File, with the number of arguments at 0. Next, create a new input parameter of Module C of type File, also with the number of arguments at 0. Connect these two parameters. See the modified workflow 2nd from the left (the connection is highlighted).

7.2 Exporting Pipeline Workflow to Script

Scripting
Pipeline workflows (.pipe files) may be exported as scripts. This enables trivial inclusion of pipeline protocols in external scripts and integration into other applications. Currently, the LONI Pipeline allows exporting of any workflow from XML (*.pipe) format to a makefile or a bash script for direct or queuing execution.

Simply open up any workflows, make changes if necessary, and choose File -> Save As… Choose a folder and specify file name and file format and Pipeline will export this wrokflow to your desired format.

7.3 Remote GUI Invocation

If you are running a remote executable that starts up a GUI, you need to follow these instructions to be able to visualize the user interface on your local machine. First of all, make sure that you are running an X server on your computer (X11 on Mac, XWin on Windows, or equivalent). Secondly, you need to wrap the tool that you intend to run into a script that sets the proper environment before execution. This entails the setting of the DISPLAY environmental variable. Now, instead of running the executable directly from a Pipeline module, you need to run the wrapper script. For instance, we can have a bash script ‘matlab.sh’ that has the following contents:

#!/bin/bash

# take ip address as an input parameter
ip_address=$1

# set environment
export DISPLAY=${ip_address}:0.0

# launch the matlab gui
/usr/local/bin/matlab

exit $?

Note that ${ip_address} is a variable that is extracted from a user-provided parameter and needs to correspond to the IP address of your local computer. Alternatively, if you want to avoid using the wrapper script, you can use the Package Mapping Utility.

Finally, in the module definition dialog, under the Execution tab, click ‘Show Advanced Options’ and check the ‘Requires external network access’ checkbox. This will make sure that the job is submitted to a compute node that has external network access and can communicate with your local X server.

7.4 Workflow Diff Utility

DiffExample
Users can now compare workflows within the Pipeline interface to determine the differences. In order to launch this component, look for the Diff Workflows item under the Tools menu. A dialog will appear, with two panels arranged side-by-side and four buttons. Use the Load First Workflow and Load Second Workflow buttons, arranged above the respective panels, to load the two workflows that are going to be compared. The Run Diff button at the bottom will run the comparison algorithm and produce visual results to the user.

There are four basic operations that are communicated to the user. These are: Added, Removed, Modified, and Unchanged. The diff tool thus gives a series of edits that will take the first workflow and produce the second. The legend connected to the Run Diff button describes the color scheme used to represent each of the edit operations.

Double-clicking on a module will move the viewport of the other workflow to display the corresponding module (if there is one). Right-clicking on the module gives a ‘Show module level differences’ option. Clicking this item will show the differences between the clicked module and the corresponding module in the other workflow.

ConfigDiffDialog
Finally, the Configure button on the bottom right of the window will produce a dialog that has a set of tunable parameters for the diff algorithm. These are already set to generally optimal values, but the user can change them to meet particular needs. The parameters are described below.

Child Propagation Constant: To establish correspondences between workflows, a similarity propagation method is used. This parameter tells the algorithm how strongly the similarity between two modules affects child modules.

Parent Propagation Constant: Similar to child propagation constant, but describes the effect of similarity on parent modules.

Select the attributes to include in the computation of the similarity metric: In this section, there are checkboxes for four module characteristics (Module Name, Author Name, Package Name, Tags) and each of these attributes, if checked, has an associated weight. These are the four module components that are used, along with their respective relative weights, when computing the similarity between any two modules. At the moment, all other module attributes are ignored.

Minimum Changes Required Between Iterations: In order to compute the differences between workflows, the algorithm first needs to establish correspondences between nodes in the two graphs. This is done in an iterative way, gradually approaching a minimum edit distance. This parameter allows the user to specify a minimum number of changes required between any two iterations. Increasing this value will result in faster convergence, but a potentially poorer mapping.

Minimum Improvement Ratio Between Iterations: Much like the previous parameter, this one controls the speed at which the mapping algorithm converges. More specifically, after each iteration, a mapping score is computed and compared to that of the previous iteration. If the improvement is insignificant, it makes sense to stop iterating. Again, increasing the value improves performance, but may degrade the quality of the module correspondences across the two workflows.

Module Edit Distance Threshold: This parameter tells the diff algorithm how different two modules should be before they are considered unrelated. In other words, when two corresponding modules are compared, there is a threshold edit distance above which we mark the module in the first workflow as ‘Removed’ and the corresponding module in the second workflow as ‘Added.’ Below the threshold, the two modules are labeled as ‘Modified.’ Raising this value means the user has some prior knowledge that a lot of the modules in one workflow have been significantly altered in the other workflow, as opposed to being replaced by analogous modules.

Parameter Edit Distance Threshold: Similar to the above threshold, this one works on the parameter level. The purpose of this is to accurately describe the parameter-level differences between modules. This is relevant when a user double-clicks on a given module after running the diff tool. Again, a higher value implies that corresponding and different parameters are being significantly altered between the two workflows, as opposed to being removed in one workflow and created from scratch in the other.

Set Edit Operation Colors: This is simply a convenience for visualization. The user can specify the colors used in labeling modules in the diff interface.

Previous: 6. Creating Modules Table of Contents
  1. Validation
  2. Executing a workflow
  3. Client disconnect/reconnect
  4. Server status
  5. Pausing a workflow
  6. Stopping a workflow
  7. Restart a module
  8. Module statuses
  9. Viewing output
  10. Debugging execution
  11. Report a bug

5.1 Validation

When you execute a workflow, the first thing the Pipeline does is validate it and check for errors. When the Pipeline does validation checks, modules show “Validating” status. You can also do that without actually executing the workflow. To start the stand alone validation go to Execution->Validate, and validation will automatically begin. If a connection is needed to a server the Pipeline will prompt you for a username and password. If any errors are found a dialog will pop up listing all the errors found in the workflow.

undefined

If your workflow is very large, you may want to run validation periodically on it as you’re building to check for errors early on.

5.2 Executing a workflow

Once you’ve completed editing your workflow, you can execute the workflow by simply clicking on the ‘Play’ button at the bottom of the workflow area. If the program needs a connection to a server, it will prompt you for a username and password. If you’ve already stored a username in your list of connections and already entered password on previous runs, then it will automatically connect for you.

Once all necessary connections have been made and validation has completed the workflow will begin to execute.

New statuses

Depending on the result of the execution, and how busy the Pipeline server is, you may see several statuses for these modules:

  • Initializing – Appears when instance is preparing for submission
  • Queued – Appears when instance already submitted the job and it is on the queue
  • Running – Appears when job starts execution
  • Complete – Appears when this module finishes executing successfully
  • Error – Appears when this module has error(s). Since version 4.2, Pipeline will continue to run whole workflow execution for succeeded instances after marking failed instances.
  • Backlogged – Appears when maximum job count has been reached for current server and the server temporary blocked the instance until new slots available
  • Staging – Appears when transferring files to/from server from/to localhost
  • Incomplete – Appears when module has finished its execution and some instances failed
  • Cancelled – Appears when parents of current module failed and continuation of current module became pointless
  • Paused – Appears when user pauses a running workflow. All running modules and their successor will be paused.

These statuses give more detailed information about the modules. The status of a particular module is shown next to the module on the workflow area. Hover the mouse on the module, a popup detailed box will appear. More detailed status information about each job for that module are also shown in the execution logs, which can be opened by right clicking a module and clicking on “View Execution Info…”. This window will be discussed further in the “Viewing Outputs” section.


Depending on the module and workflow, Pipeline predicts runtime of individual jobs on the grid based on similar jobs ran in the past. It then calculates runtime of the module as well as runtime of the whole workflow based on number of instances in the workflow, currently available grid resources, and other factors. The module and instance estimate will be shown where available when mouseover (hover) on the module, and the workflow estimate will be shown when mouseover on the lower left corner where workflow runtime is displayed.

5.3 Client disconnect/reconnect

Active Sessions

Once your workflow is running on the Pipeline server, it will continue to run even though you quit Pipeline or shut down your computer. This is helpful in the case that you want to start a workflow and then check the progress on a different computer (i.e. if you start the workflow at work and want to check on the results from home). After you have pressed play on the workflow and it is executing, quit out of the Pipeline. Make sure that you do NOT press stop, otherwise the workflow will stop running. Your workflow continues to execute even though the window is no longer open. To see the executing workflow again, start up the Pipeline client and use the Connection Manager to connect to the server on which you are running the workflow. Then go to Window -> Active Sessions on the top menu, a dialog with a list of all your active workflows will pop up. You can see the file name of your workflow, start time, finish time (if it’s still running, it will show “Running”). You can select any workflow in the list and click Reconnect. Your workflow will be open on the canvas with its latest status.

Note that workflows older than 15 days will be automatically removed from Active Sessions list. You can remove it manually as well, you can either press the Reset button when it’s open on the main window, or click “Remove” on the Active Sessions dialog.

5.4 Server status

Server statuses

When you start your workflow, it is being submitted to the Pipeline server and queued up. Pipeline gives information about the status of the server(s) connected. Information about how busy the server is, how many total slots are available and how many jobs are currently being backlogged, queued, and executed on the server. All this information appears at the bottom right corner of Pipeline window when you connect to the server. For those who set up their own Pipeline servers, please refer to the Server Guide: Configuration section for more information on how to enable this feature on your server.

5.5 Module statuses

While a workflow is executing, you can press the Stop button if desired. If you press the Stop button, then execution of the workflow is permanently stopped. There is no way to resume execution of the workflow at the point when you pressed Stop. When a workflow is stopped, modules show an “Incomplete” status.

5.6 Pausing a workflow

Pausing workflow
While a workflow is executing, you can press the Pause button to temporarily pause the workflow. All running jobs/instances will be stopped and all their output files will be deleted. Output from completed jobs will be kept. You can resume execution of the workflow later by pressing the Play button.

5.7 Stopping a workflow

While a workflow is executing, you can press the Stop button if desired. If you press the Stop button, execution of the workflow is permanently stopped. There is no way to resume execution of the workflow at the point when you pressed Stop. When a workflow is stopped, modules show an “Incomplete” status.

5.8 Restart a module

Restart module
You can restart a completed or errored module in a workflow. To do so, you can either right-click on a completed module and select “Restart Module”, or open Execution Logs on the module, under Info tab click “Restart Module”. All instances/jobs for this module and its successor modules will be resubmitted to run. Their output files will be deleted as well, to avoid possible conflict on subsequent run.

5.9 Viewing output

New statuses

As the modules continue executing you can view the output and error streams of any completed module. You can bring up the log viewer by going to Window->Log Viewer or more easily, right-clicking on the module that you want to view information about and click on ‘Execution Logs.’ This will bring up the log viewer and set its focus on the module that was clicked.

Once the log viewer is open, in the left hand column you can select the instance of the module that you want to view output for.

In addition to showing detailed status information, the execution info window also displays a variety of additional relevant job information such as the server it resides on, its running time, job and session ID’s, and command string. The session ID is a unique identifier given to all active workflows and can be used, along with your workflow’s name, to easily find and reconnect to a specific workflow from your active sessions in the future.

Output Files Tab

If you are having issues with a particular workflow that does not appear to be related to a Pipeline bug, you can email us (the Pipeline development team) all the information at the top of the execution information window so we can assist you.

The output and error log tabs each contain the data captured from the application’s output and error streams, respectively. These logs can be extremely helpful in debugging failed jobs. Many tools display enough information to the output and/or error stream to determine the reason that the job failed, whether it be incorrect input files, incorrect arguments, memory problems, etc.

The image on the left shows a typical example of the type of information that tools will display in the output stream.

Output Files Tab

The output files tab contains a list of all the files created by that instance of the module, and allows you to view them or download them to your local system. If the file is viewable, you can view them by selecting the file and clicking ‘View data’. The built-in Pipeline viewer can view a wide variety of MRI image formats and derived shape formats. You can download any files by selecting the files you want and clicking ‘Get Files.’ If you want to get all the output files of all the instances of a module, select all the instances you want in the left-hand column, then select all the output files in the right-hand tab and click ‘Download’.

If provenance is enabled for a workflow,  you will also see provenance files among the output files. By clicking the “Edit Provenance” button in Output Files tab, Pipeline will download and show in Provenance Editor the selected Provenance file.

5.10 Debugging execution

Inevitably, some of the instances (or all of them) of a module will fail sometimes and the module will have a red ring around it denoting the failure. In this case, using the log viewer as mentioned in the previous section will show all the failed instances of the module highlighted in red. With the information from the output and error stream you can diagnose nearly all the problems you may encounter while executing a workflow.

5.11 Report a bug

If you find a bug in the Pipeline, you can file a bug report through the Pipeline client. Select Help -> Report a Bug from the top menu bar. If desired, fill out the optional fields for name, email and Pipeline server username. You can also attach the workflow being processed and enter in any details about the bug. Please be as specific as possible in your bug description. Submitting the form will send the Pipeline team an email with all of the information, allowing us to debug your problem.

Report A Bug

Previous: 4. Building a Workflow Table of Contents Next: 6. Creating Modules
  1. Dragging in modules
  2. Connecting modules
    1. Smartline
  3. Setting parameter values
  4. Data sources and data sinks
  5. Cloud sources and cloud sinks
  6. Adding Metdata
    1. Input data tab
    2. Grouping tab
    3. Matrix tab
  7. Conditionals
    1. File conditions example
    2. Arithmetical/Comparison example
    3. Metadata conditions example
  8. Web service modules
  9. Transformer module
  10. Remote file browser
  11. Processing multiple inputs
  12. Enable/Disable parameters
  13. Annotations
  14. Variables
  15. IDA
  16. NDAR
  17. XNAT
  18. Cloud storage
  19. Server changer

For this example, we’re going to build a workflow from modules provided to us by the LONI Pipeline server. You don’t need to use the LONI server to create workflows though, and you can make your own modules as described later in this guide. First, open a new workflow by going to File->New.

4.1 Dragging in modules

Go to the server library at the left and expand the ‘AIR’ package. Click on the ‘Align Linear’ module and drag it into the workflow canvas that you just opened. Next drag in the ‘Reslice AIR’ module under the same package. Your screen should something like this.

undefined

Please note that in the current release of the LONI Pipeline, all modules that are used in a workflow must be either from the same server (remote or locally), or a pair of a remote server and your local machine (i.e. localhost). For example, you can mix modules from the LONI Pipeline server and your local machine, but you cannot mix modules from the LONI Pipeline server and modules from the Acme Pipeline server.

4.2 Connecting modules

Each module in a workflow can have some inputs and outputs. The inputs are on the top, and the outputs on the bottom. Go ahead and connect the output of the ‘Align Linear’ to the input of ‘Reslice AIR.’

When you attempt to make a connection, the Pipeline does some initial checking to make sure the connection is valid. For example, it won’t let you connect a file type parameter to a number type parameter, or connecting an output to another output and more.

Side note: the Pipeline supports the connection of a single output parameter to multiple input parameters, as well as the connection of multiple output parameters to a single input parameter. In the first case, the value of the output parameter is simply fed into all of the subsequent input parameters. In the latter case, the multiple outputs are all executed as a part of one command using the input parameter module’s executable.

One_Output_Multiple_Inputs Multiple_Outputs_One_Input

4.2.1 Smartline

Smartline is an automatic file conversion tool. Based on information about input and output, a Smartline can be drawn which takes care of any file translation needed. It is enabled by default, and you can disable it in your Preferences.

Smartline

When Smartline is enabled and you try to make a connection between different image formats, for example Analyze Image (.img), NIFTI (nii) or MINC (mnc), you will see “Smartline” is prompted at the end node. After you release the mouse click, a Smartline will be drawn. You will notice it is different in appearance from the regular line, as it has an extra converter module to do format translation. You can always replace an existing Smartline with a regular connection by right click Smartline and “Disable Smartline”. It will delete the Smartline and draw a regular connection if the file format of input and output matches. In addition, you can hold the “Shift” key when you draw lines, which overrides your saved Smartline mode temporarily, i.e. if you disabled Smartline in preference, it will try to draw a Smartline, if you have Smartline enabled in preference, it will try to draw a regular line.

4.3 Setting parameter values

Now we need to set the values of each of the input parameters on the ‘Align Linear’ module. Double-click on the left most parameter and select an image atlas. This is a neuroimaging specific file type so you may not have one. You can double-click on each parameter afterwards and enter a value for each one.

Once you’ve set the inputs of ‘Align Linear’ you’ll want to specify a destination for the output of the ‘Reslice AIR.’ Double-click on its output parameter and specify the path and a filename you want the file to be written to.

undefined

Note that you can mix data that is located on your computer and the computer that the server resides on, and the Pipeline will take care of moving data back and forth for you. For example, the input to the ‘Align Linear’ could be located on your local drive, but you could set the output of the ‘Reslice AIR’ to be written to some location on the Pipeline server or vice versa.

4.4 Data sources and data sinks

undefined

Sometimes you will want to use a single piece of data as an input to multiple modules in a workflow, or you just want to make the workflow easier to understand. In these cases you can take advantage of sources and sinks. Just right-click on any blank space in the workflow canvas and select New > Data source… In the dialog that opens enter some information about the data source, and then click on the ‘Inputs’ tab. From here, you can click on ‘Browse’ under the text area and browse and select multiple files into the list, or you can just type in the path to a file manually. You can click ‘Find and Replace’ button to do search and replace on your input data. Note that at the top there is an option for a server in case you want the data source to represent data on another computer.

Using this same method, you can right-click on the canvas and select New > Data sink… for use in your workflow. If no data sink is specified, output files will be in the temporary directory, with system generated filenames. You can specify the output filenames and location in a data sink and connect to the output of the module, the file will be generated specifically on that destination. Starting from version 5.1, files in data sinks are not copied over from temporary directories, but rather generated directly at the module’s execution time.

undefined undefined

Sometimes you want to just specify a target directory without specifying each file individually. Data source and data sink let you do this. For Data Source, select Directory Source and specify desired directory. Optionally, you can put filters so that only filenames inside the directory that meet the filter will be included. You can also specify file types, which filter based on file extensions. You can also check Recursive checkbox, which lets you search through sub-directories recursively. After connecting this Data Source to input of other modules, files in this directory that meet the filter’s condition will be feed as input. For Data Sink, select Directory Dump and specify desired directory, then all output files connected to this Data Sink will be copied to this directory.

4.5 Cloud sources and cloud sinks

undefined undefined undefined undefined

Cloud sources and sinks are similar to regular data sources and sinks, except that data are stored in the cloud. LONI Pipeline will take care of the data transfer between the cloud vendor and the compute nodes. To use cloud sources and sinks, you need to link your cloud account instructed here. You only have to do this once; the authentication tokens are securely kept for your convenience. You can unlink/revoke Pipeline’s access to your cloud account anytime from either Pipeline’s Tools > Cloud Storage window, or from your cloud vendor account settings.

To use your data in cloud as input, simply right-click on any blank space in the workflow canvas and select New > Cloud source… In the new dialog, you can specify vendor (if you have linked multiple vendors), and you can specify input by clicking Browse & Add… A file chooser window will open up with files in your cloud. You can specify one or multiple files. You can specify Pipeline server location to stage these files. Please note for Dropbox, only files in /Apps/LONI Pipeline/ can be accessed by the LONI Pipeline.

To write Pipeline output to the cloud, simply right-click on the canvas and select New > Cloud sink… Specify vendor, paths and servers. Please note that Amazon S3 and Dropbox are supported vendors of cloud sinks.

4.6 Adding Metadata

The “add metadata” button is a feature inside regular data sources that extends its functionality, allowing you to incorporate imaging data and non-imaging meta-data together, enable queries groupings, and construct study-designs based on user-specified criteria. Both the imaging data and the metadata information are passed to subsequent modules throughout the pipeline workflow in data-metadata pairs generated by the Pipeline. You can inspect the metadata for any module’s output under the module output files panel. The metadata can be read and fed to any module (Data Extraction), and values produced by any module can be added back to the metadata (Metadata Augmentation). The metadata may be used for setting up various conditional criteria in Conditional modules. The metadata information may be represented as an XML file, as long as it’s schema is valid (well-formed) and consistent (uniform for every subject in the study), or as a tabular spreadsheet (CVS).

First create a regular data source, then double-click the data source and click “Add Metadata”. Two new tabs will appear next to the Input tab.

4.6.1 Input data tab

undefined undefined This is very similar to the data-input mechanism in data-sources but has several additional components. It has two new text areas, one on the left that is used to input the data files, and the one on the right, used to input the corresponding metadata files. These two fields are formatted in such a way that the files listed in both areas are paired with each other and are listed in the same order. For example, line #1 in the data field is linked to line #1 in the metadata field and corresponds to subject/input #1; line #2 in the data field is linked with line #2 in the metadata field and belongs to subject/input #2; and so on. By selecting a file in either of the two fields (data/metadata) automatically selects the corresponding file in the other filed for ease of viewing.

In addition to the default view (separated view), there is also an option to merge the 2 windows and create a single text area. In the merged view, the data file and the meta data file pairs are listed on each line separated by a semicolon. The merged view is very useful when both data and metadata files have to be edited at the same time like deleting several entries, copy and paste entries, find-and-replace, etc. Switching between the 2 views is very simple (view mode option on the study module “data” window is used to switch between views) and can be done at anytime.

There are also several other options on the Data tab,

• Find and Replace: used to find a specific value and replace it with user specified value in both the data and metadata sections.

• Add Data, Add Meta Data: used to input files that are locally or remotely located.

• Clear list: used to delete everything listed.

• Number of Input items: lists the number of inputs specified by the user. A mismatch error will appear if the number of data files is not the same as the number of meta data files.

• Data type: the type of data entered can be specified using this option. It can be a directory, file, number, string, or enumerated. There is no type selection for metadata since the design supports only XML file format.

There is an Import Data option next to the Server address option. This allows the user to create a study module by importing data from directories or by specifying the file paths that exist on any of the LONI servers or on the user local machine. The Pipeline automatically matches the data and metadata files and creates a study module. This option can be used only if the data and the meta data organization on the servers follow predefined rule or format such as,

undefined undefined undefined

• Filename matching rule takes a directory, finds all files under the directory and matches data and metadata that have the same core name. By selecting “Recursive” all subdirectories are recursively searched. In order to restrict the search to only certain type of data, type of file option can be used. Filters can also be used to restrict the search based on some criteria.

• Derived from metadata rule takes a list of metadata files, derives data path from an element of the metadata and matches the metadata with the derived data. In order to do this, a directory path that contains these metadata files and the element name that contains the data path has to be specified. As for the filename matching rule, recursive and the filter options can also be used.

• Derived from CSV rule takes a CSV file that contains list of subject data information in a special format. The first row in this file corresponds to the column names/heading. Any information that is required about the subject could be listed in each column but the paths to the data file for each subject must always be listed. Starting from the second row each of the subject information is listed, one subject per row. The Pipeline reads the CSV file and automatically creates one metadata file for each subject and derives the paths to the corresponding data files as well.

After the rule and the required information is chosen, clicking on the Show Items button under the Import Data checkbox will list the data and the corresponding metadata files that matched the specification in viewing text window, file type is selected based on the file extension.

4.6.2 Grouping tab

undefined

Once the input data and the metadata files are selected, various groups, populations cohorts and strata can be created based on some meta-data criteria. There are two areas under the Grouping tab (similar to the Data tab), the left section lists all the metadata files specified under Data tab, and the right section lists the groups once they are defined.

A group can be created by clicking on the “New Group” option and specifying a group name. The group name can be changed later by right clicking on the group name. Clicking on one of the Group names, a new field appears at the bottom of the window used for specifying the grouping criteria – what metadata condition specified group-membership.

The grouping criteria follow the format of WHERE clause of XQuery (URL-REFERENCE). It contains several simple boolean operators. The Pipeline queries each of the metadata files based on the user-specified criteria and returns a boolean result. If true, then the imaging data file associated with the metadata-data item will be added to the group. The operators are, ,: comma, >: greater than, >=: greater than equal to, <: lesser than, <=: lesser than equal to. Single quotes must be used for a string value and there is no need for quotes for specifying numbers.

undefined undefined undefined

Before setting up the criteria for a particular group, a specific element in the metadata has to be identified. Once this is done the element has to be defined using XPath. To specify the XPath, the XML file on the left side of the 2-pane window is selected by double clicking on it, which causes an XML tree viewer to pop up. By selecting any element in the XML file, a path appears at the bottom of the window and this is the XPath. Once this is determined, the element can be defined by clicking on Add as variable and specifying a simple name for the element. This new element can be used to set up any conditional-expression criteria for any group that is created. Multiple variables can be defines as long as their names are unique. To view the list of variables, in the Menu bar, select Window > Variables. To use a variable and set up a criterion, curly brackets are wrapped around the variable name (e.g. {varAge}>56).

Under the grouping criteria conditions similar to the following example can be used,

{CDRSCORE}>=1 and {GENDER}=’F’, where

• CDRSCORE and GENDER are variables defined,

• >=, < are boolean operators,

• and/or represent conjunctions and disjunctions.

Multiple conjunctions and disjunctions can be used. Using parentheses (), explicitly specifies operation precedence, anything inside parentheses is evaluated first.

Once the grouping criteria are defined, clicking on the Update button will save the criteria and will display the result. Members satisfying the criteria will be listed under this group and the total group size will also be visible in the right pane. At any time, clicking on the Reload button all groups will updated and will display the results of the conditional expressions. A group can be deleted by pressing the Delete Group button.

undefinedAnother way to define and create a group for certain elements in the metadata file is the following: to create 2 groups based on whether the subject is male or female, one can select the element gender/sex in the metadata file, add the XPath as variable and click on Generate Groups option. A new window appears where the name of the variable ({gender/sex}) is entered. Two groups, Male and Female are automatically generated after clicking OK. Another example where this feature is useful is when the dataset has multiple groups, patient type1, patient type2, control subjects and so on. By selecting the corresponding element in the metadata file that defines the subject group type, one can use the Generate Groups option to easily create as many groups as the number of distinct values for that element.

4.6.3 Matrix tab

undefined

The Matrix tab provides a customized table view of all the metadata or multiple metadata elements chosen from the study. Multiple metadata elements can be selected by specifying the XPath or the variable for the XPath (separated by commas). Each column in the table corresponds to a metadata element (same order as specified) and each row corresponds to the subjects (same order as specified in the Input data tab). XML tree viewer’s “Add as matrix column button” can also be used to add more metadata elements to the table. Clicking on the Generate Matrix button, a table containing these results will be generated. The table can be sorted by clicking on the header of any column and can be exported to a CSV file by clicking on the CSV file button.

You can also save metadata of the study module as a flat CSV file. Click Save metadata as CSV… button, choose filename, and click OK. One metadata will be saved as one row in the CSV file. The first row in the CSV file will be headers. The first three columns in the CSV file will be index, data value, and metadata path of the study module. Missing value will be treated as empty value (nothing between two commas).

4.7 Conditionals

Conditional module is used when the execution path of various inputs to a workflow is dependent on some criteria. Use of Conditional Modules makes the workflow more dynamic. Conditional module can be created by right clicking on the empty area in any workflow and choosing “Conditional” under the “New” option. A new dialog will appear that has three tabs. The first and second tab is similar to what is seen in other type of modules. The third tab is different and is called “Conditions”. Under this tab there is a “Condition source code” section where the conditional criteria should be entered. The syntax of the code entered is the same as the Pipeline Programming Language (PPL), which is similar to Java/C. Pipeline programming language is very simple and easy to learn.

undefined undefined undefined

Pipeline programming language supports following functions

Supported functions

Function name Parameter type Description
exists() File Tests whether the file or directory denoted by parameter’s path exists.
isdir() File Tests whether the file denoted by this parameter’s path is a directory
length() File Returns the length of the file denoted by this parameter’s path.
hasMetadata() All types Tests whether the parameter value has metadata
runXQuery(“”) All types Given a string of the ‘where’ clause of the XQuery language, returns boolean result of the query
belongsToGroup(“”) All types Given a string of group name defined in the Study module, tests whether the parameter belongs to the group
getElementValue(“”) All types Returns the value of an XML element identified by the given XPath
startsWith(“”) String Tests if this string starts with the specified prefix.
endsWith(“”) String Tests if this string ends with the specified suffix.
contains(“”) String Returns true if this string contains the specified String value.
length() String Returns the length of this string.
collectionSize() All types Returns the size of current parameter’s collection.
instanceIndex() All types Returns the index of current instance of parameter

Supported Operators

Type Operators
unary !
multiplicative *   /   %
additive +   –
relational <    >   <=   >=
equality ==    !=
logical AND &&   and (case insensitive)
logical OR ||   or (case insensitive)

Examples listed below will help better understand the functionality of the Conditional module.

4.7.1 File conditions example

This example will help understand how to set up a conditional module that chooses the execution path based on weather a file exists at a specific module output.

To create this conditional module follow the steps below,

1. Right click on the empty area in any workflow and select “New->Conditional”

2. Click on “Conditions” tab and click on “Edit” button.

3. Click on “Add” button to create a new parameter. Name the parameter, for example as “inputFile”. Choose the file type if needed and click “OK”.

4. Click on the “Condition source code” area and press the F1 Key to see a list of available parameters (NOTE: If there are no parameters declared, then there will be no parameters displayed when F1 key is pressed. New parameters have to be defined for the current conditional module before the conditional source code is specified). Choose the “inputFile” parameter by double clicking on this option.

5.Enter a “.” after the inputFile (inputFile.) to access the various functions. Choose”exists()”under “File functions” option by double clicking on it (inputFile.exists()). This condition checks if the parameter “inputFile” exists.

6. Click OK and a new conditional module is created with one input and two outputs, “TRUE” and “FALSE”. If the parameter “inputFile” exists then the conditional will feed the inputFile to the “TRUE” output Parameter else to the “FALSE” output parameter.

7. Other functional modules can be connected to the outputs of TRUE/FALSE accordingly. If one output is always used, the other output could be disabled like any other module output.

4.7.2 Arithmetical/Comparison example

This example will demonstrate how to check the value of a parameter and determine if it has positive value(this number could be output of a previous module or information in the meta data).

undefinedundefined undefined 1) Follow the previous example until the step where the parameters are defined. Click on edit and create 2 input parameters, number1, number2 and both are of type “Number”. Click “OK”.

2) In the “Condition source code” area type the following “Number1 > 0 && Number2 > 0”. This condition will check if both the inputs, Number1 and Number2 are greater than zero i.e. positive values. The conditional module created thus will have two inputs (Number1 and Number2) and four outputs (2 True and 2 False).

3) Arithmetic comparisons with other types of parameters (String, File, Numbers etc ) can also be performed using the Conditional Module. For example, a conditional module can have 5 input parameters like,

inputFile – Type: File

inputDir – Type: File

Number1 – Type: Number

Number2 – Type: Number

Name – Type: String

We can make various conditions like,

a) inputFile.exists && inputDir.isdir() :This condition checks if inputFile exists AND inputDir is a directory. This will return TRUE only if both the conditions are true since && logical operator is used.

b) inputFile.exists() || (Number1 + Number2 > 10 && Number1 * Number2 < 500): This condition checks if inputFile exists OR Number1 plus Number2 is greater than 10 AND Number1 times Number2 is lower than 500. This condition will return true if inputFiles exists OR if both arithmetical conditions are True.

4.7.3 Metadata conditions example

Another important and useful feature of Conditional Module is its ability to be used with a Study module. Metadata information from the input files can be used to create various conditions, for example “inputFile.belongsToGroup(“Young”)”, where Young is a group created under the Study Module. This condition will ensure that all the input files that belong to group Young will be fed to the TRUE output parameter. For more details on setting up groups in a study module using metadata information please refer to the Study module description.

undefined undefined undefined

4.8 Web service modules

The type of this module already implies its role in the workflow, it allows users to call web services and use its results for further processing. As of version 5.3 only SOAP (Simple Object Access Protocol) based web services are supported. Web services are described in a special XML file, WSDL files, which have different versions and 5.3 only support WSDL 1.1.

In order to create a web service module, please follow these instructions:

1) Right click on the canvas and select New->Web Service…
ws1

2) In a newly opened dialog, enter a valid WSDL location URL and click Connect.
ws2

3) Pipeline will try to connect to WSDL document and show all interfaces and methods of selected web service.
ws3
ws4

4) After selecting the interface and method, click on “Create module” button. A new web service module will appear on the canvas with all the inputs that selected method requires. Below are two examples of different methods from the same WSDL document.

The following image shows a web service module which doesn’t have any input parameter,
ws5
but the following image has 3 required input parameters and pipeline automatically defined them. Pipeline will try to detect parameter types and set them. Names of input parameters are set automatically and are not subject to change.
ws6

Let’s right click on the module and see what’s inside. The web service module has similar metadata values as other pipeline modules in their Info tabs. Parameters tab shows all input parameters as well as output paramaters. Inputs are the same as for other modules, but outputs are different. Before talking about Outputs, please note that you have couple limitations when playing with parameters of web service modules. Unlike other modules, these modules won’t allow you to change input parameter names or create new input parameters. You will only be able to create new outputs.

1) Click on Add button and a new parameter will be created, which by default is already an output parameter.The image below shows the described scenario which was done with “list_databases” method. Thus, it doesn’t have any input parameter and only has the newly created output parameter “New Parameter 1”.
ws7

2) If the newly created parameter is not selected, select it and “Select output branch…” tree will appear. This tree shows you the hierarchy of the output XML the web service provides. The Output of SOAP web service is expected to be an XML document. If you don’t select anything from the tree, then the whole result in XML format will become the return value of the selected output parameter. But if you don’t want to deal with XML documents and are only interested in getting text output from the web service, simply select the youngest child in the tree (node which doesn’t have children).

ws8
In this example, we need to take just definitions of web service’s output, so when we connect other modules to this string output parameter, we won’t have to worry about parsing XML. Of course, we could select any of the parent of “definition” node ( for example, we could select Definition, or ArrayOfDefinition, or even Root ) but in that case the return value would be in XML and the next module would need to parse it.

3) Click OK and you’ll notice the output parameter which we just created.
ws9

Now we can test our web service, simply click the Play button ( or Ctrl+R on Windows, Cmd+R on Mac ) and the web service module should complete in couple seconds. After completion, right click on the module and select “Show Results”.
ws10

A similar to Execution logs dialog will open which will provide basic information of the web service and its output.
Switch to “Output Stream” tab, there you can see the output of web service module execution.
ws11

It is a SOAP Envelope and includes namespace information for parsing the result. You may now wonder and ask such question “But didn’t we choose to have just the “definition” tag as output ?”, well please note, that when we chose that, we were configuring a single output parameter of this module and this is the output stream of the web service module which contains the whole output. It will always stay the same, no matter if the module has any output parameter or multiple of them.

In order to use the return value of configured parameter, simply connect the output to other modules.
ws12
As you can see, we got 53 results and the next module, started to execute all of them.

Finally, if you created a web service module and in the future you want to change the method or interface, you can do it by switching into tab “Service Details” in Edit Web Service dialog.

ws13

There you can check and select all interfaces and methods of the web service as well as get information about method parameters. Please note that as soon as you change the interface or method, all previously created output parameters will be removed.

4.9 Transformer Module

Transformer modules are a new type of module introduced in Pipeline version 6.1. These modules expand on the functionality of the current transformations feature that exists in the module definition window of regular modules. Allowing users to do transformations in an independent module opens up many avenues for manipulating parameters in new ways as well as simplifying workflows. Transformers follow much the same format as regular modules. You can create input parameters to hold dynamic values, such as file names, and then create transformation steps to transform the values in different ways. The steps happen sequentially and their result is stored in a single output parameter that is automatically created by the module.

1. To get started using transformers, right click the empty canvas and click the new “transformer” module type.
new_transformer

2. After creating the transformer, the module definition window opens where the users can specify any number of input parameters and then configure various transformations. As a simple example, let’s click the “Parameters” tab and add a new input parameter with the type “File”.
add_parameter

3. Click the “Transformations” tab so we can start transforming. The transformer module does not automatically include your input parameters in the resulting output unless it is told to do so. Thus, to begin transforming the input we must append it to the output of the transformer module which always begins empty. To do this, click “add”, select “append”, then change the dropdown menu from “Custom Value” to “Parameter Value”, and finally select the input parameter we created in the previous step.

4. Now we can transform this input in any way we like. To continue our example, let’s say that we know the file(s) given to this input parameter will contain the word “input” and we want to change that to “subject”. We can “add” another step, select “replace”, and then type “input” in the first box and “subject” in the second box so that the the former will be replaced with the latter. We can also select a type for our output parameter, which will be automatically created when we finish making the module. In this example, our input is a file and we want to keep the output as a file so change the dropdown menu next to “Output Type:” to file. Our transformer window should now look like this:

transformer_example

5. Click “OK” at the bottom of the window to finalize our module. It will look like a smaller version of a regular module:
transformer_module
6. To complete the example, we can add a data source of input files to connect to the transformer module’s input parameter, as well as an executable module to connect to the transformer’s output parameter. It is important to note that transformer module’s cannot execute on their own and must be connected to an executable module. After executing, the evaluation logs of the transformer module can be checked by right clicking the transformer and it displays each step and the corresponding result.
transformer_module1logs

The example above was very simple, but you can create a variety of complex transformations using the 4 available transformation types:


Currently, transformer modules are not meant to replace the old transformation feature and there is some overlap in the functionality of these 2 features. The old transformations feature excels at manipulating output parameters and setting up definitions for optional parameters.

4.10 Remote file browser

Remote browsing Remote File Browser

Now with Remote File Browser you will be able to browse remotely the files located on the server and select them as executable locations, parameter values, and data sources and sinks. This feature appears when you check the “Remote” checkbox and click on the “Remote browse…” button or for some cases like data sources simply by clicking Add button and selecting Remote file.

4.11 Processing multiple inputs

One of the strengths of the LONI Pipeline is its ability to simplify processing of multiple pieces of data, by using the same workflow you use to process a single input. The only change you need to create a data source to hold the multiple inputs. The data source can then be used as the input to any module in the workflow.

You can even provide multiple inputs to multiple parameters. For example, if you have a parameter on a module with a data source feeding in 4 inputs and another parameter also with a data source feeding in 4 inputs the Pipeline will submit 4 instances of that module for execution with each pair of inputs being submitted together. If you were to bind 4 inputs to a data source, and 5 inputs to another, the Pipeline would submit 20 instances of this module for execution. The commands will be composed of the dot product of all the inputs provided. For the latter case, the order of iteration depends on the order of the parameters. In other words, if the 4 inputs (say: A, B, C, and D) are provided to the module’s first parameter and the 5 inputs (say: 1, 2, 3, 4, and 5) to its second parameter, the Pipeline would generate command arguments in the following order:

A 1, A 2, A 3, A 4, A 5, B 1, B 2, B 3, B 4, B 5, C 1, …
In fact, this principle generalizes to any number of parameters. The last parameter is always iterated first, then the second-to-last, and so on.

Alternately, you can use a .list file (a file ending with a .list extension which contains the path to all input files) to specify multiple input files.

Note that the cardinality of modules will be matched up whenever possible in the workflow, and whenever there is a mismatch, the inputs will be multiplied. Here is an example to illustrate.

undefined In this workflow the Pipeline will execute 4 instances of every module.
undefined In this workflow modules A and C will have 4 instances. Module D will have 5 instances and module B will have 20 instances.

Also, it is worth mentioning that it is valid to connect two output parameters to the same input parameter. Let’s look at the example below:

undefined

Let’s say that module A creates an output file called A_OUTPUT and module B creates an output called B_OUTPUT. Module C describes the GNU copy command, and has two input parameters – Source and Target, both taking one argument. The output parameters of module A and B are connected to module C’s Source input parameter. Finally, let module C’s Target parameter be bound to some target path, “/nethome/users/someuser/”.

The resulting execution is as follows – module A and B will run and create their respective output files, and module C will then execute two commands:

cp A_OUTPUT /nethome/users/someuser/
cp B_OUTPUT /nethome/users/someuser/

If the location you’re running this workflow at has a cluster, the pipeline will run both commands concurrently; if a cluster is not available, both commands will run in series and wait for completion before moving on to any subsequent modules.

4.12 Enable/Disable parameters

3 State buttons Exported parameter

Most modules have 2-3 required parameters on them, and several more optional parameters. If you want to exercise any of those additional options, simply double-click on the module and you’ll see a list of all the required and optional parameters for that module. For each additional option you want to use just click on the box on the left side of its name to enable, disable and export it. When the checkbox is not checked, parameter is disabled and Pipeline will not require to input value for that parameter. If checkbox is checked, parameter is Enabled and Pipeline will require to input value for that parameter. Finally when checkbox is checked and has double line, it means that current parameter is exported. Notice that you are not able to disable parameters that are required.

4.13 Annotations

undefinedAs your workflow becomes larger and larger at times you may forget what a particular section of it was meant to perform. To help jog your memory, you can add annotations to your workflow to remind you what you were doing later on, or as notes for other people who use your workflow. The Pipeline currently supports textual and graphic annotations. To add an annotation, right-click on an empty area of the canvas and select either ‘Add Annotation’ or ‘Add Image.’ A dialog will pop up and, based on type of annotation you are creating, you will be able to enter text or select an image. Click OK when finished and you should see a translucent box appear in your workflow where you clicked. You can move the annotation around by just clicking and dragging. You can also copy and paste annotations just like other modules. Lengthy text annotations can be collapsed to reduce clutter in a workflow, then expanded to retrieve full descriptions. A ‘Hide Annotations’ option in the workflow toolbar can be utilized to completely hide all annotations from the canvas.

4.14 Variables

undefinedTo make things easier when entering values for module parameters, you can define variables to represent a path name that can then be used as the input or output to a module parameter. You can access the variables window by going to Window -> Variables. Click on the Add button, then type in the Name (whatever you want to call the variable) and the Value (the path associated with the variable). The Scope column shows the module group name where this variable is created. Variables are inherited from parent module group to child module group, but variables defined inside child module group cannot be seen by its parent. If you want to continue adding more variables, click on the Add button again; otherwise, simply close the Variables dialog box. Now, in order to use a variable in your workflow, you use the convention {variableName} as the value for your input and output parameters (i.e. surround the variable name with curly braces). The Pipeline will parse the actual path location of the variable for you when it executes.

Pipeline supports two special variables – {$username} and {$tempdir}. {$username} is predefined for all workflows and its value is the username of the user that runs the workflow. {$tempdir} requires configuration by the Pipeline server administrator either via the Pipeline server installation utility or the server terminal GUI. Once configured, its value will be the path to a globally-accessible scratch directory. You can use both in the same way that you use other variables.

4.15 IDA

undefinedThe Pipeline has the capability to utilize data from the LONI Image Data Archive (IDA). Pipeline takes advantage of our cluster nodes to download files in parallel from the IDA database. This improves download time drastically, and you don’t have to keep connected to the server during the download. You can also enable metadata so that metadata files will be downloaded along with data as a Study design module.

In order to establish a connection to the database, go to Tools > Database. Under IDA tab, enter The Pipeline has the capability to utilize data from the LONI Image Data Archive (IDA). Give your IDA username and password and click Connect. You will see on the right hand side the data that you have access to (you will have to either upload your own data through the IDA web interface at https://ida.loni.usc.edu/login.jsp, or log into IDA and put existing files into your account).

Select the files that you want to process with the Pipeline, desired file format and where do you want to put the data. You can put data remotely on the server, or locally on your machine. If destination is remote, check the Remote box and specify server name. If you want to include metadata, check Include metadata check box, and select metadata file destination server. Click on Create Module, after a while a new workflow will be created with an IDAGet module and a data source (if include metadata was not selected) or a study (if include metadata was checked).

undefinedundefinedundefined undefined At this point data files are not downloaded. (Metadata files are downloaded, if you have it enabled.) You will notice the output of the IDAGet module has the file type you specified. You can now connect this output to the input of your workflow and run the workflow. As the first module of the workflow, data will be downloaded from IDA and fed directly to the next module. Notice the data and metadata downloaded from the IDA will be temporary stored as intermediate files of the workflow, they will be deleted if you reset the workflow.

undefinedundefined If you like to use data from IDA over and over again, it is better to download the data the first time to some permanent location and reuse it later. You can do so by creating a data sink and connect it to the output of the IDAGet module. You can either list output items one by one, or use directory dump. After successfully running this workflow, you can copy this data sink and paste it to any workflow, right click on it and choose “Convert to study”. The data sink will be automatically converted to a study module with proper inputs. Later if you want to reuse this data set, you can simply copy this study module to your workflow.

4.16 NDAR

undefined undefined undefined The Pipeline supports integration from the National Database for Autism Research (NDAR) database. First of all, you need to link your NDAR credential in LONI Pipeline. Login with your NDAR credential under Tools > Database & Cloud Storage. Once it’s connected, give package ID(s) (see below for more info) you would like to download, then select file type and the Pipeline server address. When you click Create Modules, a workflow will be created with specified package ID and file type. You can connect your processing workflow to the output parameter and run the workflow.

Please note, the majority of NDAR packages are very large in size (over 1GB is common), so downloading a package may take a long time. Once the download is complete, it will list all data files (dicom, nifti, minc, analyze img) in the package as inputs.

undefined undefined Package ID: When you create a new package, you can find out the package ID after you specify the package name on NDAR website. To find out package IDs of existing packages, open Download Manager to find out the IDs.

4.17 XNAT

undefinedThe Pipeline supports integration from the XNAT database. By providing the XNAT Catalog file (which is an XML file identifying your data, it can be downloaded from XNAT web interface), Pipeline takes advantage of server’s cluster nodes to download files in parallel from the XNAT server, and to do file conversion if necessary. The mechanism is similar to the IDA downloading, which provides tight integration on your processing steps, improves download time drastically, and you don’t have to keep connected during the download. You can also enable metadata so that metadata files will be downloaded along with data as a Study design module.

Pipeline-XNAT interface requires XNAT Catalog XML file from an XNAT server. Catalog file is an XML file that contains a list of sessions/entries, each entry is represented as a unique URI on the XNAT server. Catalog files can be easily obtained on XNAT’s web interface. For more information, please check our detailed step-by-step protocol for anonymizing, uploading, downloading and utilizing data from XNAT database.

Picture1

Anonymize Subject data

Open Pipeline Client and type anonymize at the search window. Choose the module. Connect a data source with all the dicom directories that needs to be anonymized and save it the required location. Run the workflow to anonymize the dicom files. One could also change the .das file that is used here as the default and based on the user requirement a new new .das file can be generated.

Uploading files to XNAT central

Go to XNAT server and login if you have a username if not click on register to create one.

Picture2

Picture3

Picture4

Picture5
Once you login, click on New and choose Project.

Enter the information on the project form and also choose the accessibility option and submit.

Also you could create new subjects under the project, by clicking on new Subject and filling out the information that is required.

To upload images, click on Upload and choose Images,

Picture6

Picture7

Picture8

Picture9

Picture10

Choose Option1: Choose the project to which you want to upload the data. Select the .zip file and upload the images.

Once the uploading is done, follow the instructions to review and archive the uploaded data.

Now go to Pre archived images and submit the sessions so it is achived in the specific project. For eg, Under Upload option choose “ Go to pre-archive” section.

Here on this page you will see a list of all the images that are uploaded.

Click on each session and select the Project, Subject and session option and click on submit to archive the sessions.

Once the subject/sessions are submitted, you can view them under the main Project page.

Downloading archived files using Pipeline

Picture12
Picture13

Picture14

Picture15

Picture16

Picture17

Picture18

Picture19

Choose the Project that you are interested in. Go to MR sessions. Click on Options and select Download.

This will open another window as shown below. Choose sessions and data type, and select Option 2 (XML) as download format.

Click on submit and an XML file opens.

Right click on this file and save it to you local computer.
Open the Pipeline client (PL 5.1). Go to Tools and select Database (IDA/XNAT).

Under XNAT tab, browse and select the xml file that was downloaded from the XNAT central website. Fill in the username and password information and connect.

Also one could download the data in different formats. Choose one. The data can also be saved on a remote server or on the local machine.

Click on Create Module and connect a LONI viewer to view the data that is being downloaded, or module with appropriate input to process the data, or a data sink with specified download file location path to save the data.

Run the workflow, XNATGet module will download the data.

4.18 Cloud storage

undefined undefined undefined undefined undefined

You can specify your data in the cloud as input and output to any Pipeline workflows. Currently supported cloud storage vendors are Amazon S3, Box and Dropbox. To start, link your cloud account to the LONI Pipeline under Tools > Database & Cloud Storage > Cloud Storage tab.

To link your Amazon S3 account, you need to specify Access Key ID and Access Key, which can be found here (after login, it’s under Access Credentials). Copy and paste the Access Key ID and Access Key and click “Link Amazon S3”, the status under Amazon S3 should show “Linked”.

To link your Box account, click on “Link Box…” button and click on “Open Link Page” button. Your browser will open a web page and you need to login with your Box account. After successfully authenticate, you can close the web page and go back to LONI Pipeline and click “Done” button. Now the status under Box should show “Linked”.

To link your Dropbox account, click on “Link Dropbox…” button and click on “Open Link Page” button. Your browser will open a web page and you need to login with your Dropbox account. After successfully authenticate, and click “Allow” button, you can close the web page and go back to LONI Pipeline and click “Done” button. Now the status under Dropbox should show “Linked”.

You can now use your data in the cloud as input and have results saved to the cloud by using the Cloud Source and Cloud Sink modules.

4.19 Server changer

Server ChangerSuppose you have more than one Pipeline servers running, each of them is configured so that all executables have the same path. In this situation, you want to change the server address on some or all the modules in a workflow quickly, the server changer tool lets you do this. Select Tools -> Server Changer, specify particular regular modules, data modules, or all of them, and choose the new server and click “Change”. Note the new server must be already stored in Connection Manager.

Previous: 3. Interface Overview Table of Contents Next: 5. Execution

Table of Contents

  1. Introduction
  2. Installation
    1. Requirements
    2. Downloading
    3. Setup and launching
  3. Interface overview
    1. Server library
    2. Personal library
    3. Workflow area
    4. Connection manager
    5. Provenance editor
    6. Preferences
    7. Search feature
    8. Checking for latest updates
    9. Starting GUI from command line
    10. Running from the command line
      1. Submitting workflows from command line
      2. Managing workflows from command line
  4. Building a workflow
    1. Dragging in modules
    2. Connecting modules
      1. Smartline
    3. Setting parameter values
    4. Data sources and data sinks
    5. Cloud sources and cloud sinks
    6. Study module
      1. Input data tab
      2. Grouping tab
      3. Matrix tab
    7. Conditionals
      1. File conditions example
      2. Arithmetical/Comparison example
      3. Metadata conditions example
    8. Web service modules
    9. Transformer modules
    10. Remote file browser
    11. Processing multiple inputs
    12. Enable/Disable parameters
    13. Annotations
    14. Variables
    15. IDA
    16. NDAR
    17. XNAT
    18. Cloud storage
    19. Server changer
  5. Execution
    1. Validation
    2. Executing a workflow
    3. Client disconnect/reconnect
    4. Server status
    5. Pausing a workflow
    6. Stopping a workflow
    7. Restart a module
    8. Module statuses
    9. Viewing output
    10. Debugging execution
    11. Report a bug
  6. Creating modules
    1. Module definition
      1. Info tab
        1. General module information
        2. Citation information
      2. Parameters tab
        1. General parameter information
        2. Parameter types
        3. File types
        4. Parameter arguments size
        5. Advanced parameter information
          1. Select dependencies
          2. Transformations
          3. Output/Error stream extraction
          4. Metadata extraction
          5. Output list file
      3. Execution tab
        1. Executable location
        2. Advanced options
      4. Metadata tab – Metadata Augmentation
    2. Alternative methods
      1. From help file
      2. Module Suggest
    3. Module groups
  7. Advanced Topics
    1. Syncing Execution Flow
    2. Exporting Pipeline Workflow to Script
    3. Remote GUI Invocation
    4. Workflow Diff Utility

The LONI Pipeline workflow application includes features that allows users to easily describe their executables in a graphical user interface. Instead of manually managing intermediate data in a script, the LONI Pipeline handles the passing of data between programs for you. Once you’ve created a module for use in the LONI Pipeline, you can save it into your personal library and reuse it in other workflows you create by simply dragging and dropping it in.

Learn more about Pipeline’s features below.

Cross Platform Compatible

Work in the operating system that suits you best. Connect from your client to execute processing and analysis remotely on other operating systems.

See software requirements

Cross Platform

Simple User Interface

Free yourself from the hassle of being bogged down by system administration and focus energy on current research problems.

See screenshots

Interface

Grid Support

Take advantage of a supercomputing environment by automatically parallelizing data-independent programs in a given analysis.

See supported grid plugins

Support

Pipeline Library

Access hundreds of predefined neuroimaging solutions, including data, modules and workflows that are automatically updated.

See modules library

Library

Other Features

Screenshots

Interface Overview undefined undefined
undefined undefined undefined