
Pipeline 4.1 supports local and remote execution in the same workflow. For example, you can have modules that run on LONI Pipeline server and also modules run on your local machine. You can connect them, the LONI Pipeline will run the workflow as if they were on the same machine. As always, you can shut down LONI Pipeline while your workflow is running. When you reconnect later, Pipeline will automatically resume your workflow by running the remaining local executions.
When you execute a workflow, the first thing the Pipeline does is validate it and check for errors. When the Pipeline does validation checks, modules show “Validating” status. You can also do that without actually executing the workflow. To start the stand alone validation go to Execution->Validate, and validation will automatically begin. If a connection is needed to a server the Pipeline will prompt you for a username and password. If any errors are found a dialog will pop up listing all the errors found in the workflow.

If your workflow is very large, you may want to run validation periodically on it as you’re building to check for errors early on.
Once you’ve completed editing your workflow, you can execute the workflow by simply clicking on the ‘Play’ button at the bottom of the workflow area. If the program needs a connection to a server, it will prompt you for a username and password. If you’ve already stored a username in your list of connections and already entered password on previous runs, then it will automatically connect for you.
Once all necessary connections have been made and validation has completed the workflow will begin to execute.

Depending on the result of the execution, and how busy the Pipeline server is, you may see several statuses for these modules:
These statuses give more detailed information about the modules. The status of a particular module is shown next to the module on the workflow area. Hover the mouse on the module, a popup detailed box will appear. More detailed status information about each job for that module are also shown in the execution logs, which can be opened by right clicking a module and clicking on “View Execution Info…”. This window will be discussed further in the “Viewing Outputs” section.
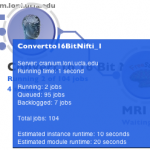
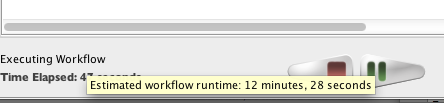
Depending on the module and workflow, Pipeline predicts runtime of individual jobs on the grid based on similar jobs ran in the past. It then calculates runtime of the module as well as runtime of the whole workflow based on number of instances in the workflow, currently available grid resources, and other factors. The module and instance estimate will be shown where available when mouseover (hover) on the module, and the workflow estimate will be shown when mouseover on the lower left corner where workflow runtime is displayed.

Once your workflow is running on the Pipeline server, it will continue to run even though you quit Pipeline or shut down your computer. This is helpful in the case that you want to start a workflow and then check the progress on a different computer (i.e. if you start the workflow at work and want to check on the results from home). After you have pressed play on the workflow and it is executing, quit out of the Pipeline. Make sure that you do NOT press stop, otherwise the workflow will stop running. Your workflow continues to execute even though the window is no longer open. To see the executing workflow again, start up the Pipeline client and use the Connection Manager to connect to the server on which you are running the workflow. Then go to Window -> Active Sessions on the top menu, a dialog with a list of all your active workflows will pop up. You can see the file name of your workflow, start time, finish time (if it’s still running, it will show “Running”). You can select any workflow in the list and click Reconnect. Your workflow will be open on the canvas with its latest status.
Note that workflows older than 15 days will be automatically removed from Active Sessions list. You can remove it manually as well, you can either press the Reset button when it’s open on the main window, or click “Remove” on the Active Sessions dialog.

When you start your workflow, it is being submitted to the Pipeline server and queued up. Pipeline gives information about the status of the server(s) connected. Information about how busy the server is, how many total slots are available and how many jobs are currently being backlogged, queued, and executed on the server. All this information appears at the bottom right corner of Pipeline window when you connect to the server. For those who set up their own Pipeline servers, please refer to the Server Guide: Configuration section for more information on how to enable this feature on your server.
While a workflow is executing, you can press the Stop button if desired. If you press the Stop button, then execution of the workflow is permanently stopped. There is no way to resume execution of the workflow at the point when you pressed Stop. When a workflow is stopped, modules show an “Incomplete” status.

While a workflow is executing, you can press the Pause button to temporarily pause the workflow. All running jobs/instances will be stopped and all their output files will be deleted. Output from completed jobs will be kept. You can resume execution of the workflow later by pressing the Play button.
While a workflow is executing, you can press the Stop button if desired. If you press the Stop button, execution of the workflow is permanently stopped. There is no way to resume execution of the workflow at the point when you pressed Stop. When a workflow is stopped, modules show an “Incomplete” status.

You can restart a completed or errored module in a workflow. To do so, you can either right-click on a completed module and select “Restart Module”, or open Execution Logs on the module, under Info tab click “Restart Module”. All instances/jobs for this module and its successor modules will be resubmitted to run. Their output files will be deleted as well, to avoid possible conflict on subsequent run.
As the modules continue executing you can view the output and error streams of any completed module. You can bring up the log viewer by going to Window->Log Viewer or more easily, right-clicking on the module that you want to view information about and click on ‘Execution Logs.’ This will bring up the log viewer and set its focus on the module that was clicked.
Once the log viewer is open, in the left hand column you can select the instance of the module that you want to view output for.
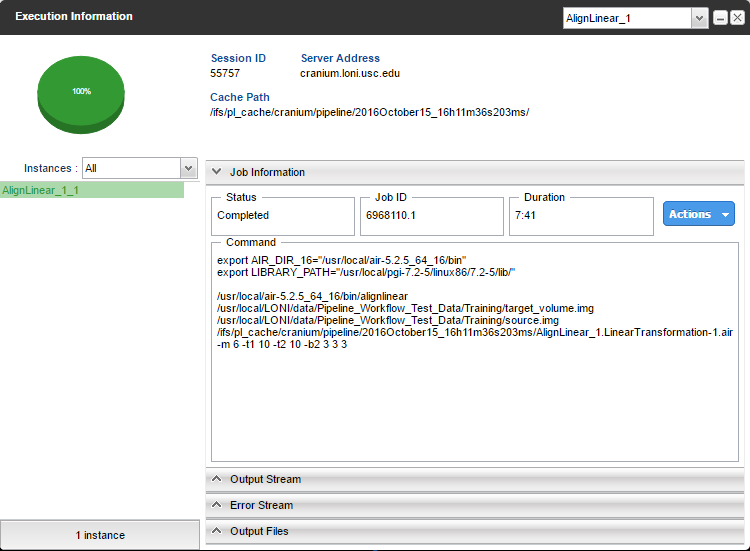
In addition to showing detailed status information, the execution info window also displays a variety of additional relevant job information such as the server it resides on, its running time, job and session ID’s, and command string. The session ID is a unique identifier given to all active workflows and can be used, along with your workflow’s name, to easily find and reconnect to a specific workflow from your active sessions in the future.

If you are having issues with a particular workflow that does not appear to be related to a Pipeline bug, you can email us (the Pipeline development team) all the information at the top of the execution information window so we can assist you.
The output and error log tabs each contain the data captured from the application’s output and error streams, respectively. These logs can be extremely helpful in debugging failed jobs. Many tools display enough information to the output and/or error stream to determine the reason that the job failed, whether it be incorrect input files, incorrect arguments, memory problems, etc.
The image on the left shows a typical example of the type of information that tools will display in the output stream.

The output files tab contains a list of all the files created by that instance of the module, and allows you to view them or download them to your local system. If the file is viewable, you can view them by selecting the file and clicking ‘View data’. The built-in Pipeline viewer can view a wide variety of MRI image formats and derived shape formats. You can download any files by selecting the files you want and clicking ‘Get Files.’ If you want to get all the output files of all the instances of a module, select all the instances you want in the left-hand column, then select all the output files in the right-hand tab and click ‘Download’.
If provenance is enabled for a workflow, you will also see provenance files among the output files. By clicking the “Edit Provenance” button in Output Files tab, Pipeline will download and show in Provenance Editor the selected Provenance file.
Inevitably, some of the instances (or all of them) of a module will fail sometimes and the module will have a red ring around it denoting the failure. In this case, using the log viewer as mentioned in the previous section will show all the failed instances of the module highlighted in red. With the information from the output and error stream you can diagnose nearly all the problems you may encounter while executing a workflow.
If you find a bug in the Pipeline, you can file a bug report through the Pipeline client. Select Help -> Report a Bug from the top menu bar. If desired, fill out the optional fields for name, email and Pipeline server username. You can also attach the workflow being processed and enter in any details about the bug. Please be as specific as possible in your bug description. Submitting the form will send the Pipeline team an email with all of the information, allowing us to debug your problem.

| Previous: 4. Building a Workflow | Table of Contents | Next: 6. Creating Modules |
March 24, 2017
Pipeline version 7.0 is just around the corner! Please read this post for full details about when the release will take place and what is new in this version!
We plan to update the server from 7pm to 11pm PST on Tuesday March 28.
After the update is complete, if you already have Pipeline installed you can launch your client and will be automatically prompted to update to the new version. Otherwise, the new version will be available for download on the products page.
The newest version of Pipeline contains many new features and improvements to the client and server, such as to the Pipeline-IDA interface, job management abilities, user quotas and more, in addition to the usual slew of bug fixes. In this section we would like to give a brief overview of a few of the bigger changes. For a full textual list of the changes made, see the Release Notes.


The most important changes to software are many times the least visible to users. The LONI Pipeline Server is now running a faster and more reliable database behind the scenes. From an end users perspective, you may not notice this change unless you are running extremely large batches of jobs (which we encourage you to do) however this change will lead to overall less database and server downtime as well as improved performance.
Note: The distributed pipeline server (DPS) will continue to be packaged with the HSQL database.
We have created a new Window for viewing detailed information about the grid and jobs. You can access it by clicking on the server statistics button location on the bottom right of the client, which will bring up a dialog containing a visual representation of every node in the grid as well as a bar graph breakdown of the slot distribution.
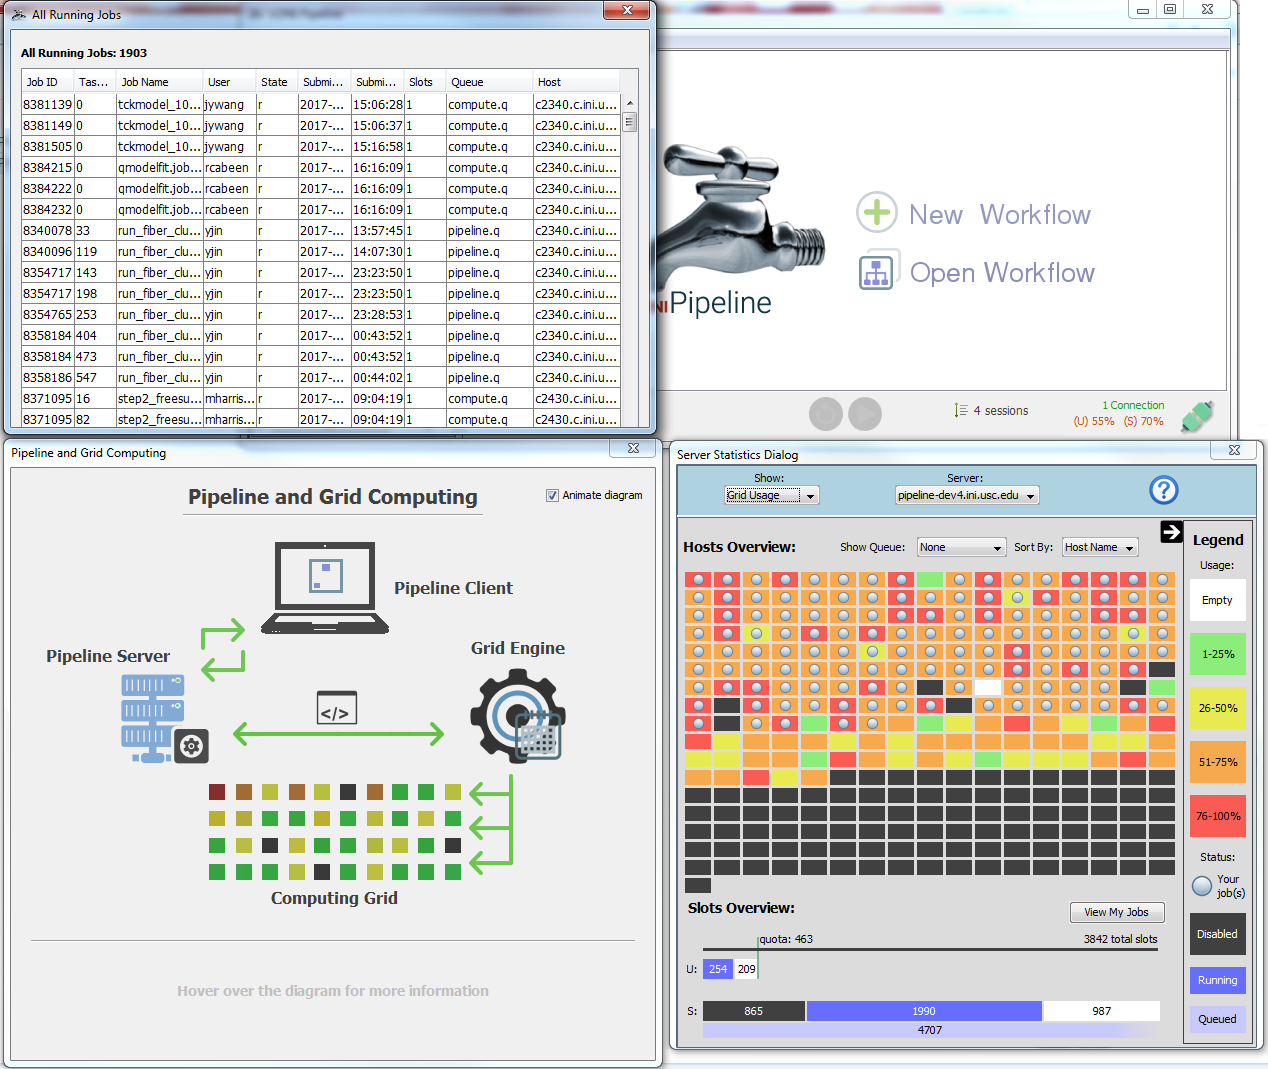
For developers: the grid information provided to the client is generated by a plugin that can be customized to work with any grid resource manager. For more information on how to make a plugin of your own, see the Pipeline Server Guide – Grid Stat Plugin API.
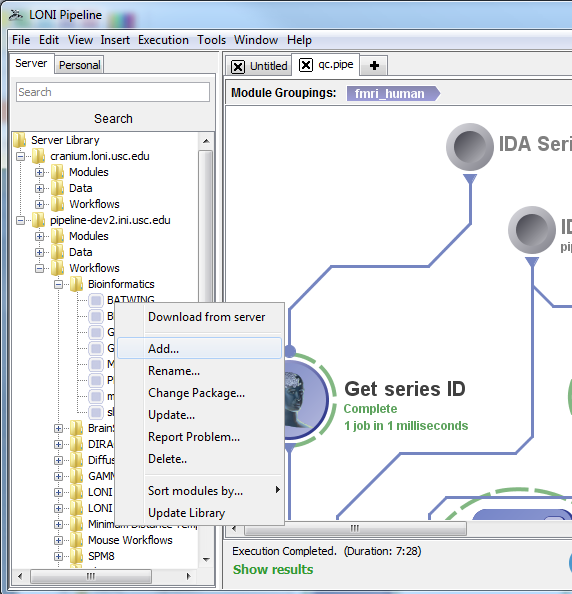
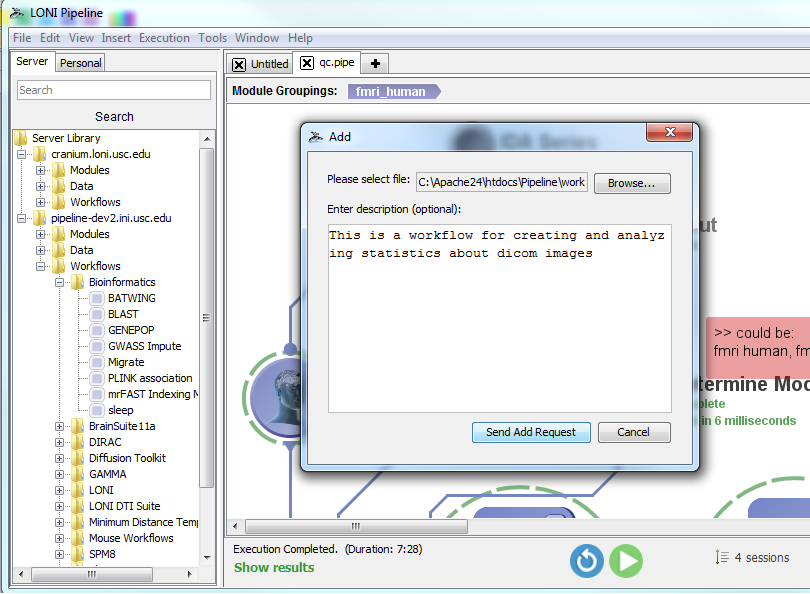
Users can request to make a variety of changes to the remote server library of modules and workflow by right clicking the server library navigator on the left side of the Pipeline client. For this Pipeline beta version, keep in mind that adding your workflows to this server’s library will not affect Cranium’s server library, however, we will transfer all changes when the beta testing phase is over.
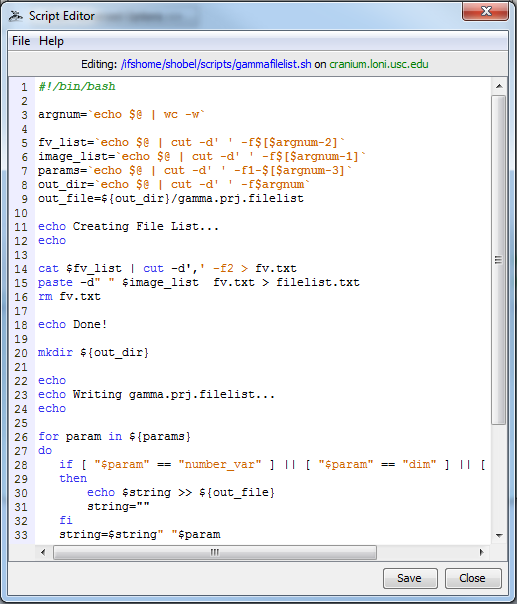
You can now create and edit local or remote* files from within the Pipeline client (* if they are on the same shared file system as the pipeline server). To begin creating or editing files, you can either click Tools > Script Editor from the top menu bar in the Pipeline window, or create a new module definition and click the “Edit Script” button from the Execution tab (see below screen shots).
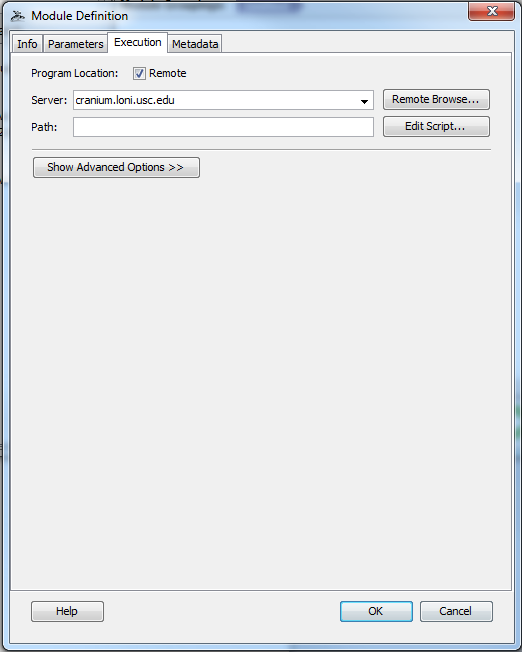
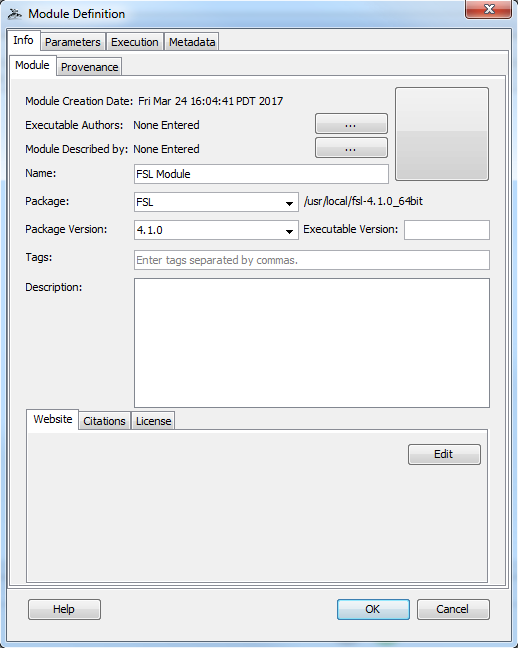
Pipeline has included a package mapping system for quite some time now. But up until this release, information about the system has been hidden from users. Now users can select a package and version for their modules from a drop down list that is populated upon connecting to a server. The path of the package on the remote server is now displayed as well. This feature, along with the remote script editor will allow users to have more control and knowledge about remote programs they use.
For anyone unfamiliar with package mapping, it is a configurable system set up by the Pipeline server administrators that maps the name of a package to the root path of that package on the server. This allows you to specify just an executable name and Pipeline will know exactly on the server where that program is. As example, a user can write “reorient” as the module’s executable path and specify that it belongs to the FSL package version 4.1.0 and Pipeline will know to look in /usr/local/fsl-4.1.0_64bit/bin for that program.
You can now set the maximum number of jobs of a particular “type” that can be running on the grid at any particular point in time. Please see the Pipeline Server Guide’s Configuration section called Non-user-based Job Management for more details about how to configure your server.
Link: http://pipeline.loni.usc.edu/webapp/

With the release of the LONI Pipeline Web App beta, users will notice that although most of the interface and functionality is the same as the desktop client, there are some differences and new features. This document will outline the various various web app in detail and serve as an informational tool for new users and old. Please keep in mind that this is a beta release and thus not all features will work as intended. For information on reporting bugs and getting support, please refer to the last section of this document.
1. Pipeline Account
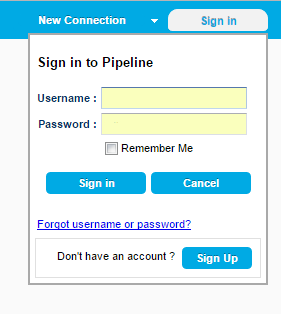 The connections bar is located at the top of the interface and there is a new button, “Sign in”. This is a feature where users will create a single Pipeline account and have access to all their saved information, such as configured connections and saved workflows, from any device.
Sign up for an account and then set up connections and begin saving workflows to your personal cloud library.
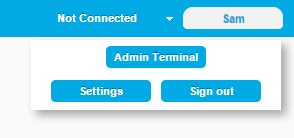
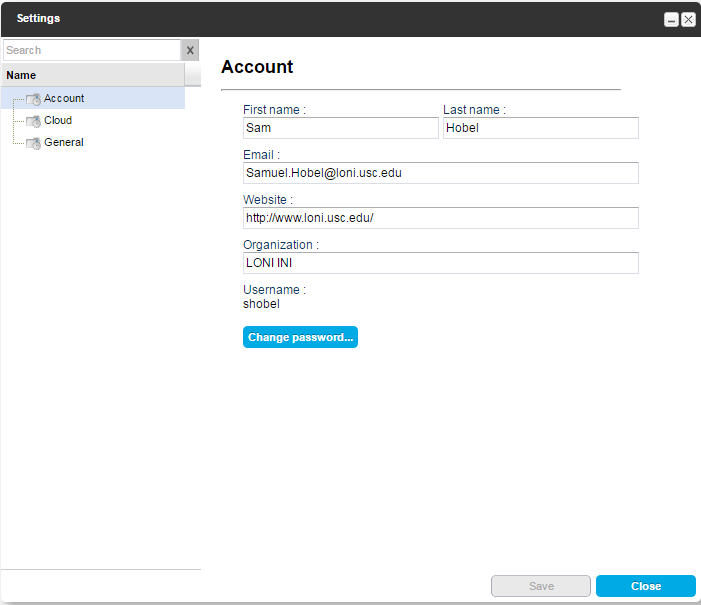
Clicking on the Sign In button after you are already logged in brings up a new menu. If you are an admin you will have access to the Server Terminal from this window. Otherwise you will just be able to edit your account Settings or Sign Out.
2. Pipeline Cloud & Auto Saving
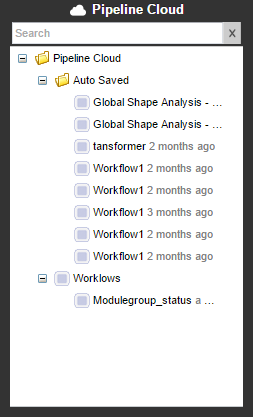 The web app’s version of a personal library for saving workflows is called the “Pipeline Cloud”. Each user is given space on the LONI server for saving workflows, which gets tied to your Pipeline account so that you can access your files from any device by logging in.
Auto saving is another feature new to the web app. Every few minutes, Pipeline will check for unsaved changes to your workflows and auto-save them to the cloud.
Your saved and auto-saved workflows in the pipeline cloud are available without needing to connect to a server.
3. Control Bar
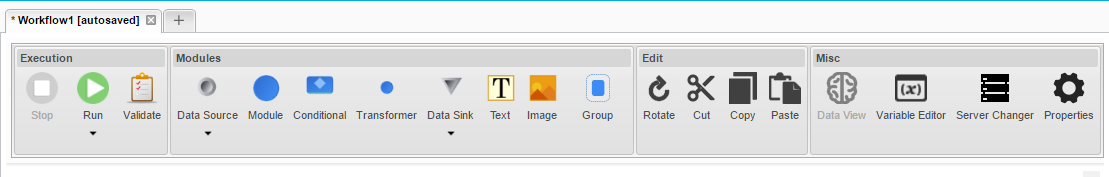
Clicking on the New Workflow button at the home page will bring up the canvas and a new control bar that gives users fast and convenient access to workflow building tools.
On the left side is the execution menu which now contains a button for validating a workflow. Next to that are buttons for creating the various of module types, text boxes, images, and a button for grouping modules together if you have more than 1 selected. Other miscellaneous editing functions that are spread out amongst different menus in the desktop client are also provided here in the toolbar.
There is a new button in the miscellaneous section called “Data View” which becomes available when a workflow is in execution mode. More details about this feature will be discussed in a subsequent section.
Clicking on the down arrow below the data source and data sink control bar icons will show a dropdown menu with the different types of data sources that can be created. You can choose a source that will hold local files, files on a remote server, in a cloud service, or in a database. We currently support 5 cloud services (Amazon S3, Box, Dropbox, Google Drive, Microsoft OneDrive) and 4 databases (LONI IDA, XNAT, NDAR, Transmart).

4. Creating/Editing Modules
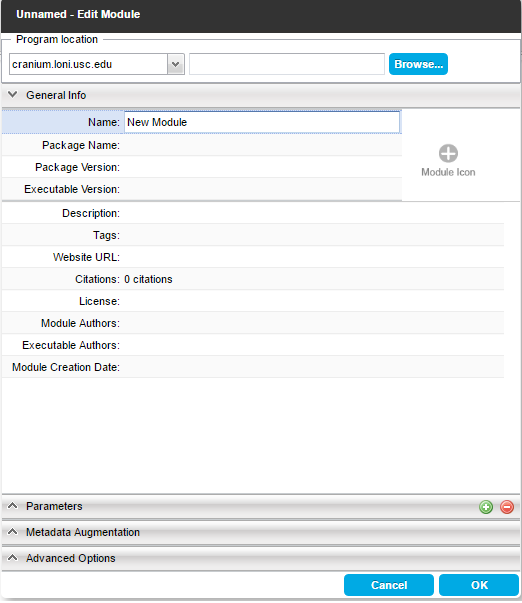
All of the module editing windows have been changed and improved in a variety of ways. They have a stacked panel layout and the data type and acceptable file types fields are now at the top of the window in a space efficient manner.
In the edit modules window, the location of the program is now the first field in the window and stays fixed at the top so that it is always visible.
In the data source/sink window, clicking on the browse button lets you specify files from any supported location, meaning you do not have create a different type of data source depending on where your files are. In addition, adding metadata has become more intuitive, being its own tab in the stacked layout. The metadata specific options, such as grouping, become available in the new tab.
Currently, being connected to a server and specifying that server in the Server Address window is required for both Local and Server files. Local execution has not been implemented yet and thus local files need to be uploaded to the remote server before processing the same way the desktop client stages local files before remote execution.
 |
|
The normal File menu options such as new, open, and save are located at the top left of the browser window, as shown below.
![]()
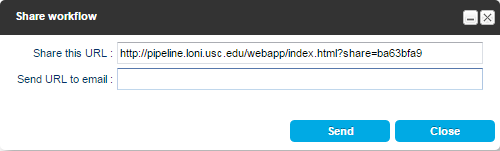
There is a new “share” button that provides a url which any user can use to open the current workflow in a browser from any device.
5. Execution

The execution process has remained relatively unchanged aside from the fact that local execution is not currently available, however there are some interface differences. A new section, “Execution info”, appears in the top control bar when a workflow is executing. Modules will create colored semi-circles around themselves representing both their status and percentage completed, and the Execution Information window has a pie chart to display this information as well.
 |
 |
6. Data View
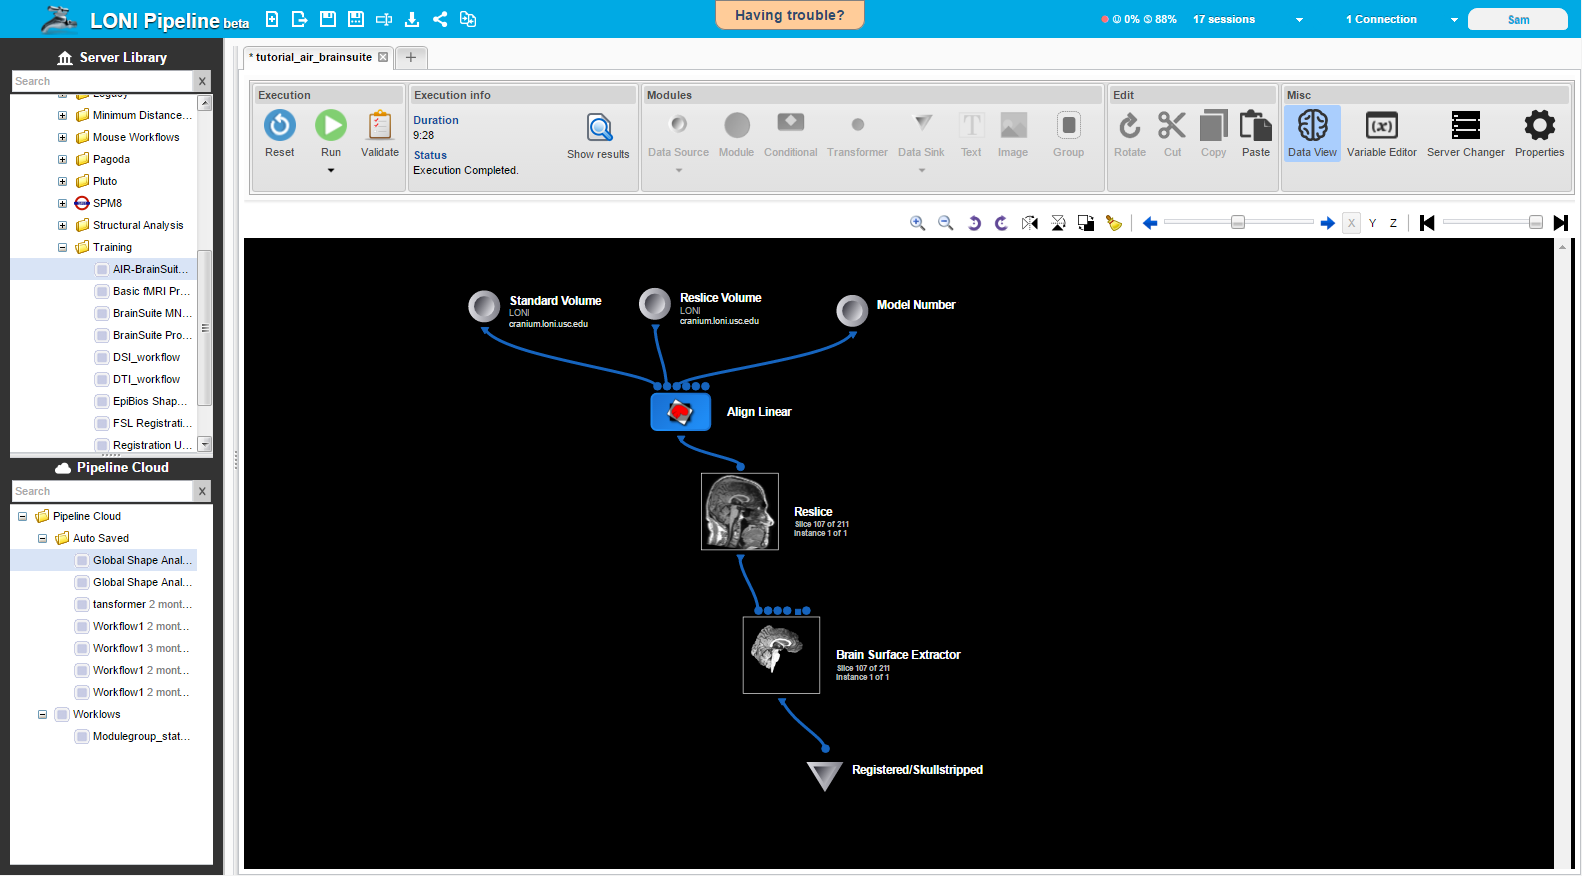 A major new feature is the Data View toggle button, which becomes available when a workflow is executing and has some viewable output files. When this button is toggled on, the icon representing modules that have outputs in a format displayable by the built-in image reader (analyze, nifti, etc) will be replaced with a small image of the module’s output file. If the module contains several jobs, and/or each job creates an output with multiple slices, as is typical with many neuroimaging outputs, a single slice from one of the outputs will be shown. A toolbar is provided below the main control bar discussed earlier that allows users to flip through slices of an output image or change between the different job outputs.
![]()
7. Support
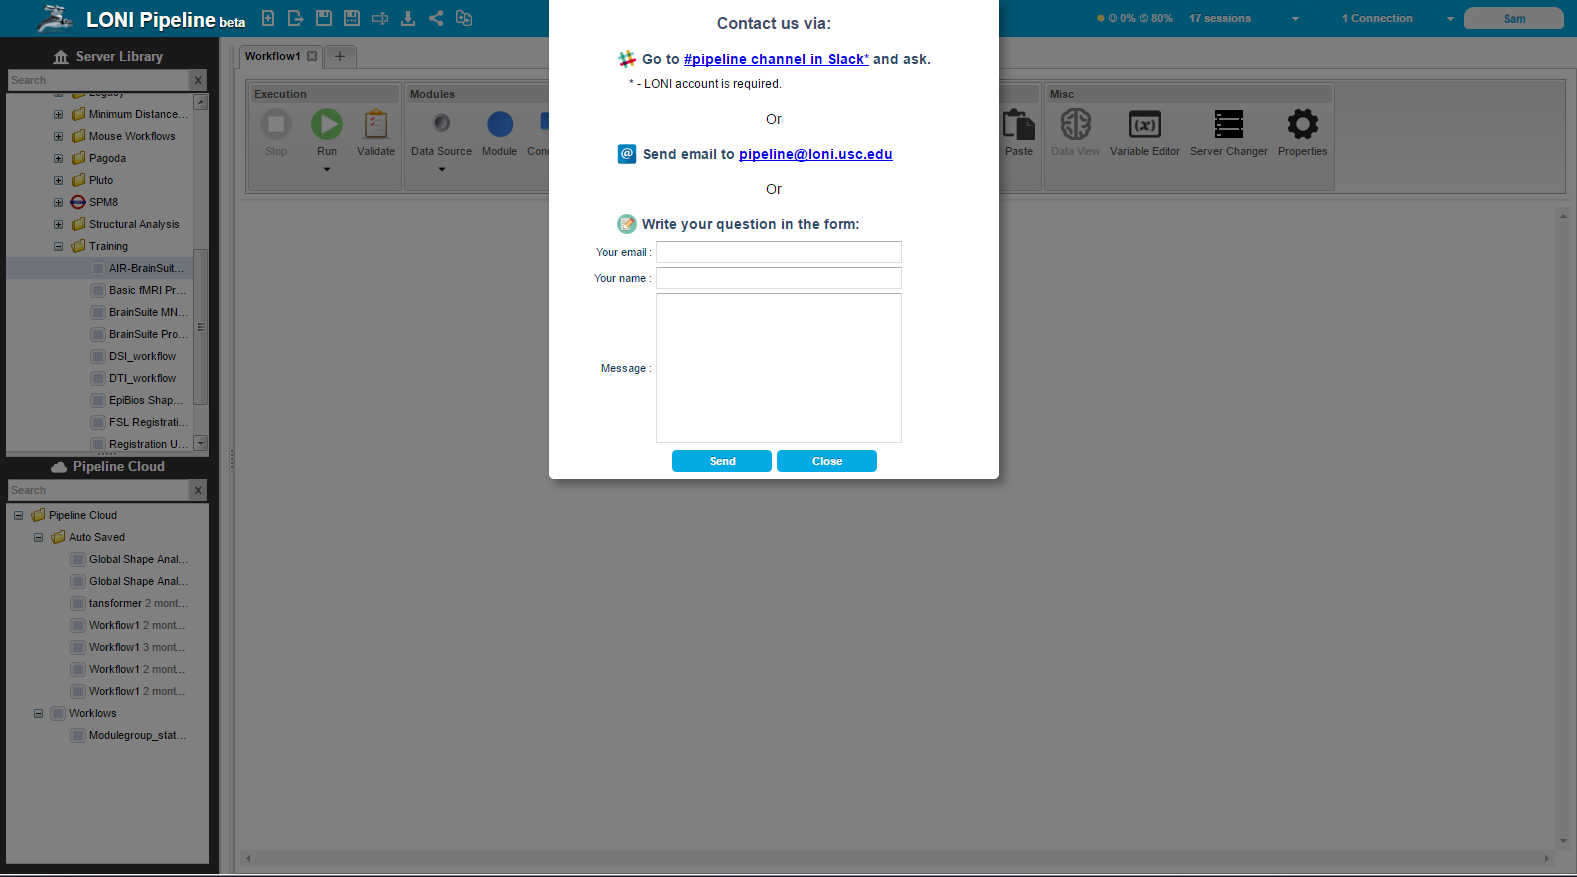
As previously noted, this is a beta release and therefore issues with certain features are expected. For this reason, there is a “Having Trouble?” button at the top center of the pipeline browser that opens a dialog presenting different options for receiving support or reporting an issues/bugs. We encourage users to ask for support and report problems as much as needed because we are not always aware of all the issues and this will help the Pipeline web app become a better product.
For more information on features not discussed in this document, please see the online Pipeline documentation and tutorials at http://pipeline.loni.usc.edu/learn/.
package com.example.pipelineapi;

import java.io.IOException;
import java.util.List;

import pipeline.api.PipelineAPI;
import pipeline.api.callback.ConnectionCallback;
import pipeline.api.callback.ExecutionCallback;
import pipeline.api.callback.JobStatusCallback;
import pipeline.api.callback.SessionListCallback;
import pipeline.api.callback.SessionReconnectCallback;
import pipeline.api.callback.SessionStatusListener;
import pipeline.api.callback.ValidationCallback;
import pipeline.api.workflow.Connection;
import pipeline.api.workflow.Job;
import pipeline.api.workflow.Module;
import pipeline.api.workflow.Session;
import pipeline.api.workflow.SessionStatus;
import pipeline.api.workflow.Workflow;
import validation.exceptions.ValidationException;

public class ApiExample implements ConnectionCallback, ValidationCallback, ExecutionCallback,
	JobStatusCallback, SessionReconnectCallback, SessionStatusListener, SessionListCallback {

	private PipelineAPI pipelineApi;
	private Workflow workflow;

	public static void main(String[] args) throws InterruptedException, IOException {
		new ApiExample().start();
	}

	private void start() throws InterruptedException, IOException {
		String workflowFilePath = "C:\\path\to\workflow.pipe";

		pipelineApi = new PipelineAPI();

		workflow = pipelineApi.loadWorkflowFromFile(workflowFilePath);

		Connection connection = new Connection("username", "password", "10.0.0.1", 8001);

		pipelineApi.connect(connection, this);
	}

	@Override
	public void onJobStatus(Job job) {
		System.out.println("onJobStatus [id: "+job.getId()
		+ ", sessionId: "+job.getSessionId()
		+ ", name: "+job.getModuleName()
		+", status: "+job.getStatus().name()
		+"]");

		if (pipelineApi.getConnections().iterator().hasNext()) {
			Connection connection = pipelineApi.getConnections().iterator().next();
			//pipelineApi.diconnect(connection);
		}
	}

	@Override
	public void onSessionCreated(Session session) {
		System.out.println("onSessionCreated = "+session.getId());
		// Example for subscription on session status updates
		Connection connection = pipelineApi.getConnections().iterator().next();
		pipelineApi.requestSessionStatus(session.getId(), connection, this);
	}

	@Override
	public void onValidationCompleted() {
		System.out.println("Validation completed.");
		pipelineApi.executeWorkflow(workflow, this);
	}

	@Override
	public void onValidationFailed(List<ValidationException> validationExceptions) {
		System.out.println("Validation failed. Exceptions count: "+validationExceptions.size());
	}

	@Override
	public void onConnectionEstablished(Connection connection) {
		System.out.println("Connection to " + connection.getAddress() + " established.");
		pipelineApi.validateWorkflow(workflow, this);
		pipelineApi.requestSessionList(connection, this);
	}

	@Override
	public void onConnectionFailed(Connection connection, String message) {
		System.out.println("Connection to " + connection.getAddress() + " failed. Message: "+message);
	}

	@Override
	public void onWorkflowLoaded(String sessionId, Workflow workflow) {
		System.out.println("Reconnect to session = "+sessionId+". Worfklow modules: "+workflow.getModules().size());
		reqeustModuleStatuses(sessionId, workflow);
	}

	@Override
	public void onSessionStatusUpdate(Session session) {
		System.out.println(session);

		if (session.getStatus().equals(SessionStatus.COMPLETED)) {
			Connection connection = pipelineApi.getConnections().iterator().next();
			// Example of reconnect to session
			pipelineApi.reconnectSession(session.getId(), connection, this);
		}
	}

	private void reqeustModuleStatuses(String sessionId, Workflow workflow) {
		for (Module module : workflow.getModules()) {
			pipelineApi.requestModuleStatus(sessionId, module, this);
		}
	}

	@Override
	public void onSessionList(List<Session> sessions) {
		System.out.println("Session list size = "+sessions.size());
	}
}
(November 03, 2015) Pipeline version 6.2 is available for download. This version has an advanced option to Modules which will always force an outer product multiplication (even when all parameters have the same amount of data). Also a session id field is added to execution log dialog and there are some important bug fixes. For more details read Release Notes.
(September 29, 2015) Pipeline version 6.1.1 is available for download. This version has redesigned execution status updates which makes workflow execution even faster as well as redesigned and faster “module restart”. It also includes couple other improvements and bug fixes. For more details read Release Notes.
A new module type that allows complex file path transformations with simple user interface.
System admins can create custom user groups and apply quota for the users in the group as well as total quota for the group. Quota can be a percentage, a hard limit, or a fixed/reserved hard limit.
Added output files information dialog for data sinks. Similar to module execution dialog’s output tab, it shows list of output files and their paths, and allows user to download/view the files..
Added unknown cardinality for string extract of output parameters. If enabled (match all occurrences), data extract will pass all matched items and the next module will have n number of instances.
Redesigned core components including backend database schema, job submission mechanism, execution and user management, and module execution statuses. These changes improve overall performance and reliability.
This feature will allow administrators to set multiple directory access control with more options and should replace the DACMode feature.
Added “add metadata” and “remove metadata” buttons for data modules. Added auto select file type for data module. Added data extract/string output parameter the option to extract the entire output/error stream.
New command line interface (CLI) options including list all active sessions, show status of a given session, and stop/reset/pause/resume a given session.
Added synchronization/update checking mechanism on server preferences from multiple sessions. When user saves preferences that are outdated (saved by another session), it will inform either overwrite or discard/refresh options. Also added multiple workflows/batch actions to reset/stop/pause/resume multiple workflows at a time.
acknowledgement | terms of use | contact the webmaster
Powered by LONI |
Software supported by:
NIH-NCRR 9P41EB015922-15 and 2-P41-RR-013642-15
NIH-NCRR U54 RR021813
NIH-NIMH R01 MH071940