
- Validation
- Executing a workflow
- Client disconnect/reconnect
- Server status
- Pausing a workflow
- Stopping a workflow
- Restart a module
- Module statuses
- Viewing output
- Debugging execution
- Report a bug
5.1 Validation
When you execute a workflow, the first thing the Pipeline does is validate it and check for errors. When the Pipeline does validation checks, modules show “Validating” status. You can also do that without actually executing the workflow. To start the stand alone validation go to Execution->Validate, and validation will automatically begin. If a connection is needed to a server the Pipeline will prompt you for a username and password. If any errors are found a dialog will pop up listing all the errors found in the workflow.

If your workflow is very large, you may want to run validation periodically on it as you’re building to check for errors early on.
5.2 Executing a workflow
Once you’ve completed editing your workflow, you can execute the workflow by simply clicking on the ‘Play’ button at the bottom of the workflow area. If the program needs a connection to a server, it will prompt you for a username and password. If you’ve already stored a username in your list of connections and already entered password on previous runs, then it will automatically connect for you.
Once all necessary connections have been made and validation has completed the workflow will begin to execute.

Depending on the result of the execution, and how busy the Pipeline server is, you may see several statuses for these modules:
- Initializing – Appears when instance is preparing for submission
- Queued – Appears when instance already submitted the job and it is on the queue
- Running – Appears when job starts execution
- Complete – Appears when this module finishes executing successfully
- Error – Appears when this module has error(s). Since version 4.2, Pipeline will continue to run whole workflow execution for succeeded instances after marking failed instances.
- Backlogged – Appears when maximum job count has been reached for current server and the server temporary blocked the instance until new slots available
- Staging – Appears when transferring files to/from server from/to localhost
- Incomplete – Appears when module has finished its execution and some instances failed
- Cancelled – Appears when parents of current module failed and continuation of current module became pointless
- Paused – Appears when user pauses a running workflow. All running modules and their successor will be paused.
These statuses give more detailed information about the modules. The status of a particular module is shown next to the module on the workflow area. Hover the mouse on the module, a popup detailed box will appear. More detailed status information about each job for that module are also shown in the execution logs, which can be opened by right clicking a module and clicking on “View Execution Info…”. This window will be discussed further in the “Viewing Outputs” section.
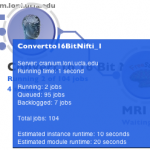
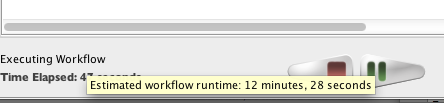
Depending on the module and workflow, Pipeline predicts runtime of individual jobs on the grid based on similar jobs ran in the past. It then calculates runtime of the module as well as runtime of the whole workflow based on number of instances in the workflow, currently available grid resources, and other factors. The module and instance estimate will be shown where available when mouseover (hover) on the module, and the workflow estimate will be shown when mouseover on the lower left corner where workflow runtime is displayed.
5.3 Client disconnect/reconnect

Once your workflow is running on the Pipeline server, it will continue to run even though you quit Pipeline or shut down your computer. This is helpful in the case that you want to start a workflow and then check the progress on a different computer (i.e. if you start the workflow at work and want to check on the results from home). After you have pressed play on the workflow and it is executing, quit out of the Pipeline. Make sure that you do NOT press stop, otherwise the workflow will stop running. Your workflow continues to execute even though the window is no longer open. To see the executing workflow again, start up the Pipeline client and use the Connection Manager to connect to the server on which you are running the workflow. Then go to Window -> Active Sessions on the top menu, a dialog with a list of all your active workflows will pop up. You can see the file name of your workflow, start time, finish time (if it’s still running, it will show “Running”). You can select any workflow in the list and click Reconnect. Your workflow will be open on the canvas with its latest status.
Note that workflows older than 15 days will be automatically removed from Active Sessions list. You can remove it manually as well, you can either press the Reset button when it’s open on the main window, or click “Remove” on the Active Sessions dialog.
5.4 Server status

When you start your workflow, it is being submitted to the Pipeline server and queued up. Pipeline gives information about the status of the server(s) connected. Information about how busy the server is, how many total slots are available and how many jobs are currently being backlogged, queued, and executed on the server. All this information appears at the bottom right corner of Pipeline window when you connect to the server. For those who set up their own Pipeline servers, please refer to the Server Guide: Configuration section for more information on how to enable this feature on your server.
5.5 Module statuses
While a workflow is executing, you can press the Stop button if desired. If you press the Stop button, then execution of the workflow is permanently stopped. There is no way to resume execution of the workflow at the point when you pressed Stop. When a workflow is stopped, modules show an “Incomplete” status.
5.6 Pausing a workflow

While a workflow is executing, you can press the Pause button to temporarily pause the workflow. All running jobs/instances will be stopped and all their output files will be deleted. Output from completed jobs will be kept. You can resume execution of the workflow later by pressing the Play button.
5.7 Stopping a workflow
While a workflow is executing, you can press the Stop button if desired. If you press the Stop button, execution of the workflow is permanently stopped. There is no way to resume execution of the workflow at the point when you pressed Stop. When a workflow is stopped, modules show an “Incomplete” status.
5.8 Restart a module

You can restart a completed or errored module in a workflow. To do so, you can either right-click on a completed module and select “Restart Module”, or open Execution Logs on the module, under Info tab click “Restart Module”. All instances/jobs for this module and its successor modules will be resubmitted to run. Their output files will be deleted as well, to avoid possible conflict on subsequent run.
5.9 Viewing output
As the modules continue executing you can view the output and error streams of any completed module. You can bring up the log viewer by going to Window->Log Viewer or more easily, right-clicking on the module that you want to view information about and click on ‘Execution Logs.’ This will bring up the log viewer and set its focus on the module that was clicked.
Once the log viewer is open, in the left hand column you can select the instance of the module that you want to view output for.
In addition to showing detailed status information, the execution info window also displays a variety of additional relevant job information such as the server it resides on, its running time, job and session ID’s, and command string. The session ID is a unique identifier given to all active workflows and can be used, along with your workflow’s name, to easily find and reconnect to a specific workflow from your active sessions in the future.

If you are having issues with a particular workflow that does not appear to be related to a Pipeline bug, you can email us (the Pipeline development team) all the information at the top of the execution information window so we can assist you.
The output and error log tabs each contain the data captured from the application’s output and error streams, respectively. These logs can be extremely helpful in debugging failed jobs. Many tools display enough information to the output and/or error stream to determine the reason that the job failed, whether it be incorrect input files, incorrect arguments, memory problems, etc.
The image on the left shows a typical example of the type of information that tools will display in the output stream.

The output files tab contains a list of all the files created by that instance of the module, and allows you to view them or download them to your local system. If the file is viewable, you can view them by selecting the file and clicking ‘View data’. The built-in Pipeline viewer can view a wide variety of MRI image formats and derived shape formats. You can download any files by selecting the files you want and clicking ‘Get Files.’ If you want to get all the output files of all the instances of a module, select all the instances you want in the left-hand column, then select all the output files in the right-hand tab and click ‘Download’.
If provenance is enabled for a workflow, you will also see provenance files among the output files. By clicking the “Edit Provenance” button in Output Files tab, Pipeline will download and show in Provenance Editor the selected Provenance file.
5.10 Debugging execution
Inevitably, some of the instances (or all of them) of a module will fail sometimes and the module will have a red ring around it denoting the failure. In this case, using the log viewer as mentioned in the previous section will show all the failed instances of the module highlighted in red. With the information from the output and error stream you can diagnose nearly all the problems you may encounter while executing a workflow.
5.11 Report a bug
If you find a bug in the Pipeline, you can file a bug report through the Pipeline client. Select Help -> Report a Bug from the top menu bar. If desired, fill out the optional fields for name, email and Pipeline server username. You can also attach the workflow being processed and enter in any details about the bug. Please be as specific as possible in your bug description. Submitting the form will send the Pipeline team an email with all of the information, allowing us to debug your problem.

| Previous: 4. Building a Workflow | Table of Contents | Next: 6. Creating Modules |